When the market has ‘wild days' — ups and downs of more than 3% in a single session — it isn't good. Wild days are associated with market downtrends. • Obsolete financial formulas assumed investments carried risks that were stable from year to year. Two Nobel laureates proved that risk changes over time. ‘Volatility clusters' give us an insight into corrections and bear markets.

Figure 1. Robert Engel III (left) and Clive Granger won the Nobel Prize in Economics in 2003 for their formulas that predict when market volatility will be followed by more volatility. Photo by Hans Mehlin. Copyright by the Nobel Foundation.
• NOTICE: This column will begin a temporary hiatus on Aug. 16, 2019. To continue receiving my articles, subscribe now to the free Muscular Portfolios Newsletter.
• Part 2 of a series. Part 1 appeared on Aug. 1, 2019. •
In Part 1 of this series, we saw that a French-speaking genius named Benoit Mandelbrot discovered fractal mathematics and demonstrated that stock-market volatility tends to "cluster" in predictable waves.
Mandelbrot passed away in 2010. He never won the Nobel Prize in Economics, which is not granted posthumously (a policy some consider to be a failing).
The Nobel laureates who were honored for predicting volatility clusters were Robert Engel III, an American statistician at New York University, and Clive Granger, a British econometrician who taught at the University of California, San Diego, among other institutions.
Engel and Granger's insight was that stock prices have periods of low volatility that can change unexpectedly to high volatility. Previously, economists had assumed that market volatility was fairly constant.
The two researchers developed formulas to project when high volatility would lead to additional high volatility. This trait of markets is modeled in software called ARCH (autoregressive conditional heteroskedasticity). A later extension is known as GARCH (Generalized ARCH).
Why is this important enough to win a Nobel Prize? Because periods of high volatility — for example, when the S&P 500 goes up or down more than 3% in a single day — are not neutral indicators. These "wild days" tend to mark corrections and bear markets. Solid bull markets, when no correction is near, tend not to have any wild days at all.
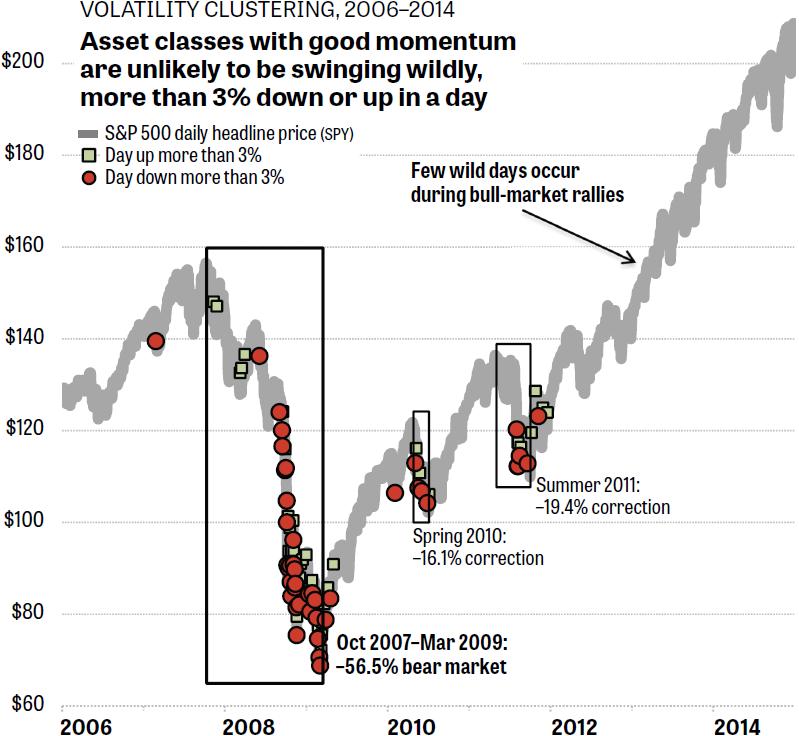
Figure 2. "Wild" days tend to occur only during corrections and bear markets, or shortly before or after. They are not neutral — a wild day does not "take the pressure off the market." Quite the opposite. Wild days tend to signal that more wild days are yet to come, making a bear market even worse, as in 2007–2009.
In Part 1 of this series, we examined a graph of the S&P 500 (represented by the SPY exchange-traded fund) from 1997 through 2005, a nine-year period. In Figure 2 today, we analyze 2006 through 2015. At the scale of this Web page, trying to cram both periods into a single graph would make the wild days too small to see clearly.
Figure 2 reinforces the message that 3% up days are not "buy" signals, and 3% down days are not "sell" signals. Any wild day is a warning sign that a correction or a bear market is coming or may already have begun.
Look at late 2007 and early 2008 in Figure 2. Before it was clear that the world was entering a severe bear market — the global financial crisis — the S&P 500 experienced five separate 3% up days. (These days are represented by green squares in Figure 2.) Treating these up days as a cause for joy would have been a mistake. Periods of high volatility, whether the moves are up or down, are correlated with downtrending markets. The price of SPY fell more than 56% by Mar. 9, 2009.
This observation is good enough to win a Nobel Prize but, fortunately, individual investors don't need to worry about wild days, periods of high volatility, or any of that. With the index ETFs we can choose from today, it's easy to construct a portfolio that tilts into assets that are in uptrends and out of assets that are in downtrends. So-called Muscular Portfolios are examples of such "asset rotation" strategies, as described at more length in my one-page summary.
In the third and final part of this series, we'll examine the recent years 2015 through 2019 and — more importantly — how we can easily navigate around these corrections and bear markets without being rocket scientists.
• Part 3 appears on Aug. 8, 2019.
With great knowledge comes great responsibility.
—Brian Livingston
Send story ideas to MaxGaines "at" BrianLivingston.com
