Investing strategies have short-term momentum (the past 3 to 12 months predict the next month) but long-term reversion (the past 3 years deceive you). • Institutions that hire outside money managers routinely fire any analyst who underperforms a benchmark for 3 years. Some fire analysts after just 1 or 2 years. You’ll be shocked to see how much you could earn if you did exactly the opposite.

Figure 1. Don’t fall into the trap of thinking that the past 3 years’ worth of performance predicts good returns in the following 3 years.
• Part 3 of a series. Parts 1 and 2 appeared on Apr. 9 and 11, 2019. •
We saw in the previous two parts of this series that:
- The stocks that individual investors sell tend to do much better than the stocks the investors buy as replacements.
- The outside money managers that financial institutions fire after 1 to 3 years of underperformance tend to go on to make more gains than the impressive managers that the institutions hire as replacements.
What if we could use these two pieces of information to make more profits in our own investment portfolios?
Fortunately, three researchers have given us the answer to precisely that question. They are Bradford Cornell of the California Institute of Technology, Jason Hsu of Research Affiliates et al., and David Nanigian of the American College. Their recent white paper, “The Harm in Selecting Funds That Have Recently Outperformed” shows us the problem and describes ways we can avoid what I’d call “reversion subversion,” so we can make more profit in our portfolios.
The authors state: “Beginning with the work of DeBondt and Thaler (1985) and Jegadeesh and Titman (1993), researchers have found that individual stock returns are characterized by short-term momentum followed by long-term reversals.” In this case, “short-term” means the past 3 to 12 months, whereas “long-term” is defined as the past 3 years. I’d call that latter period the “intermediate term” — in my view, the long term is one complete bear-bull market cycle or more — but let’s adopt the white paper’s definitions for now.
To demonstrate 3-year “reversion to the mean” — the fact that strategies which outperformed in the past 3 years tend to underperform in the following 3 years — the researchers used Morningstar data to define very different portfolios:
- The Winner Strategy buys those active equity mutual funds that were in the top 10% of performance over the past 3 years, and it holds them for the next 3 years. This portfolio returned 8.04% annualized.
- The Median Strategy buys funds that were between the 45th and 55th percentile of past 3-year performance — i.e., exactly in the middle. That resulted in a much better 9.77% return.
- The Loser Strategy buys funds that were in the bottom 10%. These unloved strategies actually did the best, returning a far superior 10.40%. (For the methodology that was used to make these selections, see the link to the white paper at the end of this article.)
These results are detailed in the white paper’s Table 1 (see my Figure 2, below). Don’t worry if some of the technical terms are unfamiliar. All you need to understand is that the Loser Strategy performed the best on every technical measure of performance: Sharpe ratio, alpha, and so on.
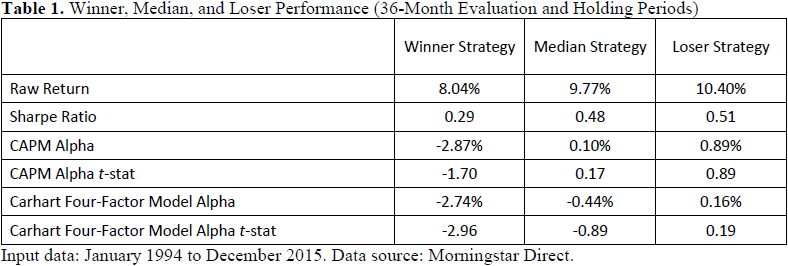
Figure 2. The so-called Loser Strategy, which held for 3 years the active equity funds that had underperformed a benchmark the worst in the past 3 years, far surpassed the funds that had 3 years of past outperformance.
Determining the investment advisory newsletter that performed the best in the past 12 months, and following its advice for the following 12 months, is often called “chasing performance.” Mark Hulbert, the founder of the Hulbert Financial Digest (which closed in 2016 after 34 years), proved that this behavior would have resulted in your portfolio losing 32.2% annualized over his 23-year study period. (Your $100,000 would have shriveled to only a lucky $13.13, not considering the corrosive effect of inflation.) In the same period, the Wilshire 5000 earned a positive return of 13.1% annualized. Hulbert’s findings are described in a 77-minute audiotape (download) of his presentation to the 2013 national conference of the American Association of Individual Investors.
Cornell, Hsu, and Nanigian have performed a valuable service for us by showing that chasing performance is also bad for our wealth when the measurement is made using 3-year performance. Not only that, the evidence gets even worse for people who live by raw returns.
To make things a bit more interesting, the three researchers studied the effect of buying those funds that underperformed their benchmarks by more than 1% per year. For added spice, they examined those funds that had underperformed by more than 3%. The researchers assumed that the underperforming funds would be liquidated (fired) and the other funds would be held (hired).
The white paper’s Table 2 (my Figure 3, below) shows the awful truth:
- The funds that underperformed by more than 1% returned 9.76%. The other funds returned only 8.73%.
- The funds that underperformed by more than 3% returned 9.95%. The other funds returned only 8.89%.
Once again, the funds that previously underperformed their benchmarks beat the other funds on every statistical measure of raw gain and risk-adjusted return. The authors repeated this finding when the evaluation and holding periods were reduced to 2 years instead of 3 years.
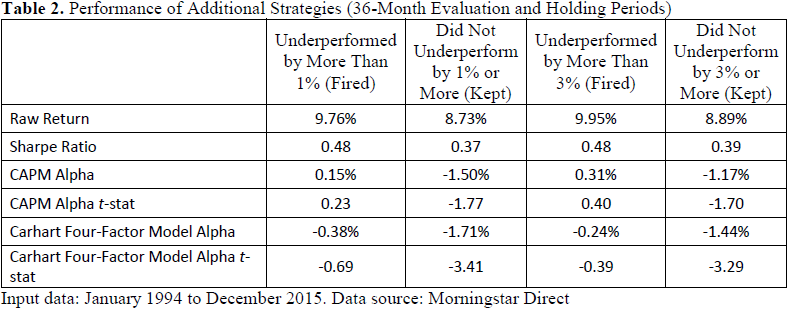
Figure 3. The funds with the worst 3-year underperformance — they lagged more than 3% per year below their benchmarks — outperformed the better-performing funds over the following 3 years.
Does all this mean that we should now go out and deliberately buy whatever mutual funds have performed the worst in the past 3 years? Not at all!
The authors identify in their conclusion 11 characteristics that tend to predict a strategy’s future performance more surely than merely the past 3 years’ raw return. The white paper helpfully provides citations to 11 academic studies that demonstrate how these traits work.
To read the researchers’ fascinating but concise 12-page paper, please see Cornell, Hsu, and Nanigian, 2016.
In the fourth and final part of this series, we’ll see the easiest way to make reversion to the mean work for us in our own personal investment portfolios.
• Part 4 appears on Apr. 19, 2019.
With great knowledge comes great responsibility.
—Brian Livingston
Send story ideas to MaxGaines “at” BrianLivingston.com
