One of the most powerful predictive forces in the natural world is the bell curve or ‘normal distribution.’ But don’t make any trades based on it! • An inexpensive device demonstrates the curve’s age-old principle — as well as Fibonacci numbers, a favorite of technical analysts — although you should be careful about any assumptions you might make.
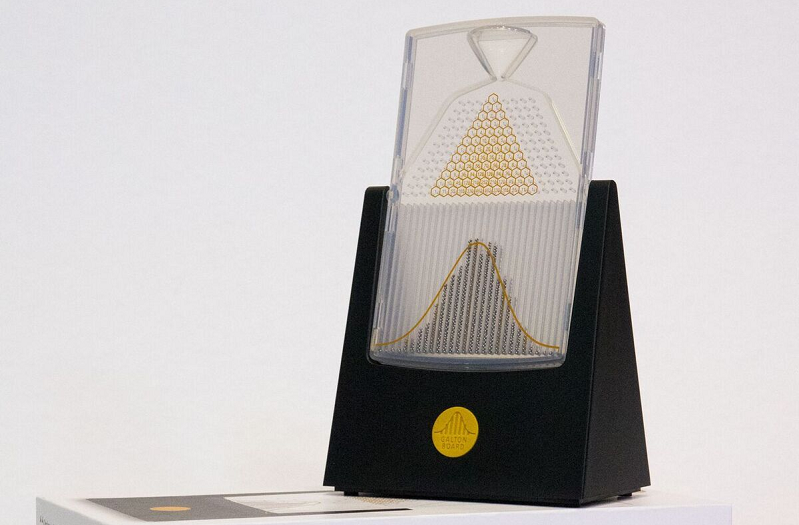
Figure 1. The Galton Board is a $39.95 gizmo that packs a lot of mathematical theory. Photo by Four Pines Publishing.
In my Mar. 7, 2019, column, titled “How Do You Know Your Strategy Will Work in the Future?”, I discussed the well-known bell curve and other ways of guessing the probability of random events. The stock market, for better or worse, isn’t perfectly random and doesn’t follow a bell curve, but we’ll get to that a little later. In the meantime, a fascinating little device helps us to visualize the power of randomness.
Mark Hebner and Jesse Fulton of Index Fund Advisors (IFA), a fee-only wealth-management firm based in California, sent me a review copy of a working device that demonstrates the bell curve using 3,000 tiny metal balls. (I sent IFA a gift of equal value.)
A photo of the gizmo is shown in Figure 1. The so-called Galton Board consists of a thin, plastic box that you tip up or down with your finger. You start the demonstration with all of the little balls poured into a cone at the bottom of the board. When you rotate the mechanism, the balls fall down and bounce off a series of pins. By randomly bouncing left or right, most of the balls end up in the center of the 28 bins, with fewer and fewer in the outer channels. (That happens in most cases — I’ll explain some exceptions in a minute.)

Figure 2. This animated GIF file shows the “start” position of the Galton Board, when all the metal balls are stored in the cone, and the “running” position, when the balls are randomly bouncing left or right through a series of obstacles. Animation by GaltonBoard.com.
Figure 2 shows the Galton Board at work. Beginning with the static, “start” position, the touch of a fingertip turns the box over, launching the running of the balls. (If Figure 2 does not show you a 9-second looping sequence, your computer, tablet, or phone may not support animated GIFs.)
In my tests, the metal balls never perfectly matched a smooth bell curve. Some bins always held slightly more or fewer balls than the theory would predict. (You can see this in Figure 2, where the balls in the four center bins don’t quite align with the curve.) But after trying these runs dozens of times, the balls roughly fill out the expected bell shape. It wouldn’t be reasonable for us to expect a precise outcome from any random process.
Here are those exceptions I mentioned: Because randomness is, well, random, it’s mathematically possible for all of the balls to someday wind up entirely in the left half or the right half of the bins. That’s just the luck of the draw. If you happen to try the device, you can easily simulate this rare event yourself by simply tilting the mechanism at a 45-degree angle to the left or right before you start the balls rolling. Talk about putting a big thumb on the scale!
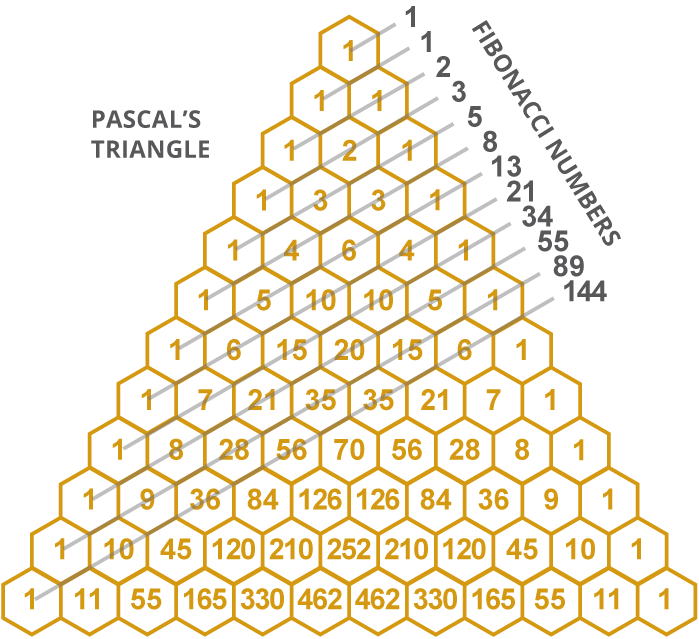
Figure 3. The Galton Board illustrates a real-life example of Fibonacci numbers, a repeating pattern that seems to show up in stock-market movements. Illustration by GaltonBoard.com.
If you look carefully at Figures 1 and 2, you’ll notice that a triangular pattern of numbers in orange hexagons is printed on the board. This is called Pascal’s Triangle. It shows the effect of adding two numbers in a series to get a third number, and then continuing that process indefinitely.
This produces a series known as the Fibonacci numbers. Yang Hui, a Chinese mathematician who lived from 1238 to 1298, first studied this series. He was followed by Blaise Pascal, who published Traité du triangle arithmétique (Treatise on the Arithmetic Triangle) in 1653.
The Fibonacci series begins with 1, 1, 2, 3, 5, 8, 13, and continues indefinitely. Each number is the sum of the previous two numbers. Some technical analysts use the ratios between these numbers to try to time market movements, as explained in a ChartSchool article.
As shown in Figure 3, the Fibonacci series is the result when you add the numbers on each diagonal line through the orange hexagons. On the sixth diagonal in Figure 3, for example, the numbers 1, 4, and 3 add up to 8. Oooh, that’s cosmic, man.
The numbers inside the hexagons represent the likelihood that a ball starting at the top of the board will reach a particular point. On the bottom row, if there were exactly 2,048 balls, the expected result (after an infinite series of tests) is that 462 balls wind up in each of the center two bins. About 330 will come to rest in the neighboring bins, and only one ball will fall into each of the bins on the extreme left and right.
That’s the theory of a “normal distribution,” anyway. If the process is truly random, about 68% of the balls are said to come to rest within one standard deviation of the center post. About 95% will fall within two standard deviations and 99.7% within three standard deviations. The remaining few balls will be outliers.
When it comes to the stock market, nothing is normal
The Galton Board is a fun way to spend a few minutes experiencing randomness in a physical way. The problems arise when people assume they can apply rules like a “noprmal distribution” to the stock market or any free market of products or services.
Mathematicians have shown that markets actually follow a Levy distribution. As I explained in my Mar. 14, 2019, column, that principle is named after French mathematician Paul Levy, who demonstrated this rule in the mid-20th century.
To summarize that entire article in a nutshell: If you plot stock-market returns on a left-right axis — with extreme losses on the left and extreme rallies on the right — there will be a lot more “fat tails” than the bell curve would predict.
University of Chicago economics professor Eugene Fama, a 2013 Nobel Prize winner, wrote after studying market moves: “Large changes, of more than five standard deviations from the average, happened two thousand times more often than expected.”
If need be, go back and read those columns to understand this mismatch between the bell curve and the way actual stock markets develop bubbles and crashes. And then, if you’re so inclined, get a Galton Board and play with it as a fun doohickey demonstrating mathematical relationships that occur almost by magic in the natural world.
To obtain a Galton Board, visit the Four Pines Publishing website.
For more information about Galton boxes and their relationship with Pascal’s Triangle and Fibonacci numbers, visit the GaltonBoard.com website.
With great knowledge comes great responsibility.
—Brian Livingston
Send story ideas to MaxGaines “at” BrianLivingston.com
