Whether you call it evidence-based investing, 21st-century behavioral science, or Muscular Portfolios, you’re living through a financial revolution. Simple, easy formulas beat the market — complex formulas fail. (The S&P 500 gained 97% in the 10 years ending February 2016, while the average equity hedge fund actually lost 6%.) With trading costs at all-time lows, it’s a Golden Age for you to make serious money.
Best money-making trick on Wall Street — save as much as 3%
 My new book, Muscular Portfolios (Amazon, B&N), reveals today’s most profitable long-term trading strategies, whether you hold a 401(k), an IRA, or any kind of brokerage account. The simple formulas — fully disclosed and free to use — have (a) long track records of success and (b) behavioral reasons why they won’t become overgrazed and stop working. There’s no longer any need to pay 1%, 2%, 3% or more of one’s life savings annually to any Wall Street “wealth manager” just to do the same thing anyone can now do for themselves on the Internet. The evidence for this from top experts is thoroughly documented in the book. But the following quick bullet points will give you everything in a nutshell. (Click the images to enlarge.)
• We are over 100 million short-term and long-term traders
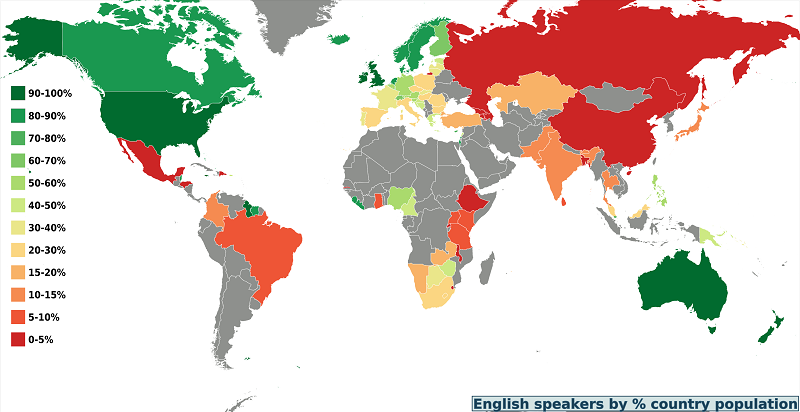 There are more than 2 million short-term traders — individuals who transact more often than monthly — just in English-speaking countries like the US, UK, Canada, Australia, etc., according to Broker Notes. A vastly larger group of well over 100 million households in those countries have money in 401(k), IRA, and similar tax-deferred plans. In the US alone, there are more than 62 million such wealth-holders. Their median account balance was $60,000, but the average was much higher: $229,000. Unfortunately, many top 401(k) plan providers — for example, the US government with 5 million accounts and the Vanguard Group with 2 million accounts — allow no more than two portfolio changes per month. Furthermore, most plans allow participants to buy only index funds, not individual stocks. Because of such frequency and selection restrictions, tens of millions of people have no choice but to be long-term traders of index funds (transacting just once a month or so).
• Are you a trading genius? Only 2% are.
 There’s no doubt that some traders are truly geniuses. But how many? To use an example from a different game, there are more than 300,000 tournament-rated chess players worldwide — but only one-half of 1% are rated as grandmasters! The skill distribution in stock trading is similar. Numerous studies show that fewer than 2% of intraday traders make consistent profits. (Barber et al., 2013; Fishe et al., 2010.) An analysis of 360,000 market participants during an exhaustive 15-year study found that more than 85% of day traders actually lost money each year. (Trader Feed, 2014, also see MarketWatch, 2016.) Brilliant short-term trading requires vision and discipline that not everyone has.
• Muscular Portfolios are for the other 98% of us
 If you’re one of the 2% who are trading geniuses, good for you! Keep it up! Muscular Portfolios are for the rest of us: the 98% of short-term traders who are just average, plus 100% of the people in 401(k)-type plans who can change positions only once or twice a month. Muscular Portfolios are fully disclosed, are revealed completely free of charge, trade no more than monthly, are supported by websites that require no fee or registration, and are designed never to lose more than 20% to 25% — even in the most severe market crashes, when the S&P 500 is down 50% or worse.
• Our human nature works against our trades
 The 21st-century science of behavioral finance shows why it’s difficult, if not impossible, for humans to make consistent trading profits. We think we’re so rational. But when we suffer a financial loss, our logical prefrontal cortex silently switches control to our tiny, primitive amygdala, which reacts to fear (photo, left). On average, short-term traders buy stocks that go up 5.7% in the next 12 months. But the stocks that the traders previously sold soared 9.0%! (Odean, 1998.) Our minds deceive us — a big reason why most traders underperform.
• The more often you trade, the less profit you make
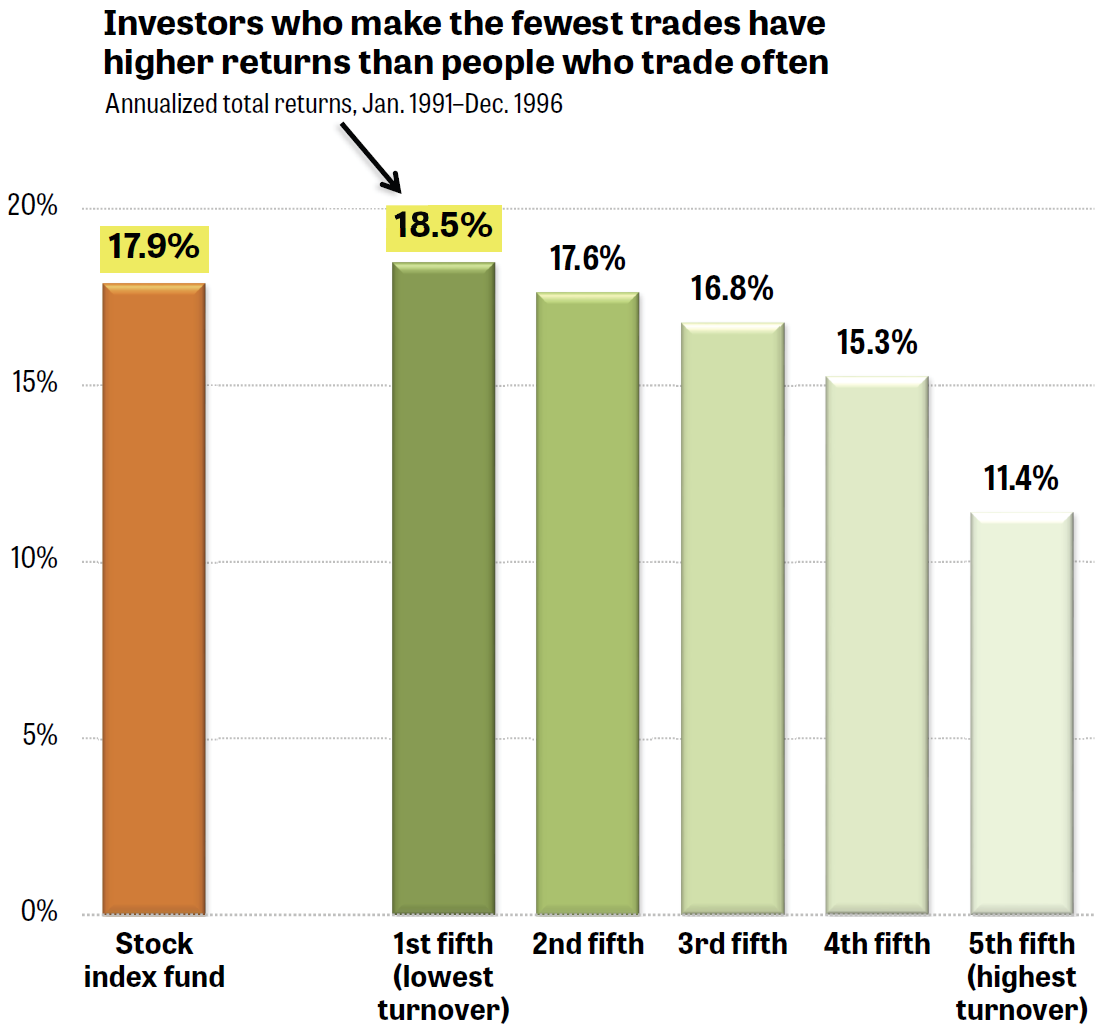 Two business professors analyzed the accounts of 78,000 traders over a six-year period. (All names were deleted.) The one-fifth of traders who most frequently made transactions earned 7 percentage points less profit per year than the one-fifth who least often traded. The one-fifth who traded the least beat the Vanguard 500 Index by 0.6 percentage points a year. The traders with the most transactions far underperformed both the long-term traders and the market itself! (Barber & Odean, 2000.) This huge gap occurred not just because of the errant opinions described above, but also due to the additional trading costs — which add up far faster than many people realize.
• A 2-point ‘behavior gap’ is due to attempted market timing
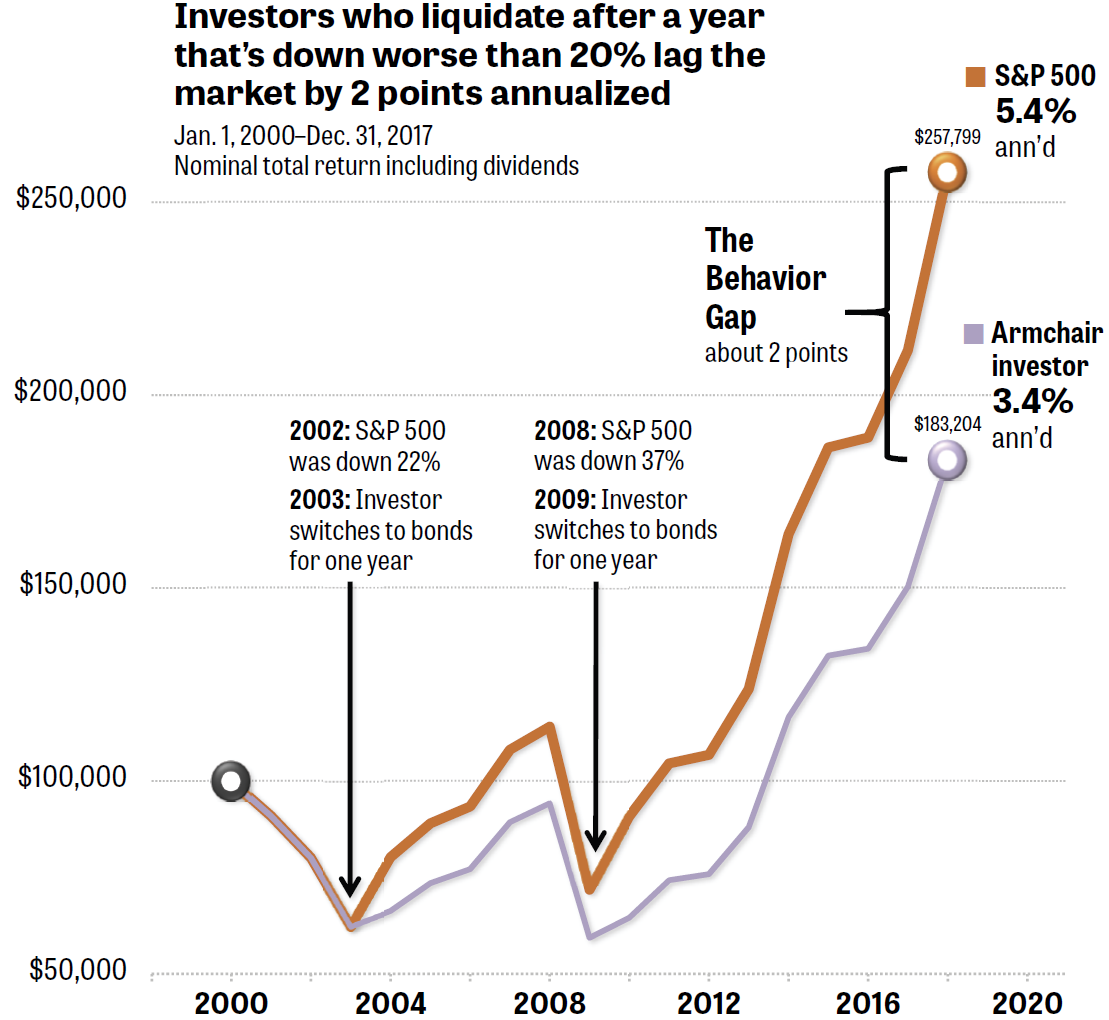 To choose just one example, buyers and sellers of Russell 2000 small-cap index funds reap 2.2 points less gain per year than the index itself. Why? Traders jump in and out at the wrong times! As an illustration of this principle, Charles Rotblut of AAII shows that a skittish holder of the S&P 500 — an “armchair investor” — who sold at the end of any 20%+ down year, and then repurchased the index 12 months later, would underperform the market by exactly 2 points annualized. (Click chart to enlarge.) Losses of 30% or more — which strike the US market every 10 years, on average — make people’s survival instincts kick in, compelling sales at deep losses and terribly hurting long-term performance. If you’re a human being, you’re not immune to these instincts.
• Follow portfolios that never lose more than 20% to 25%
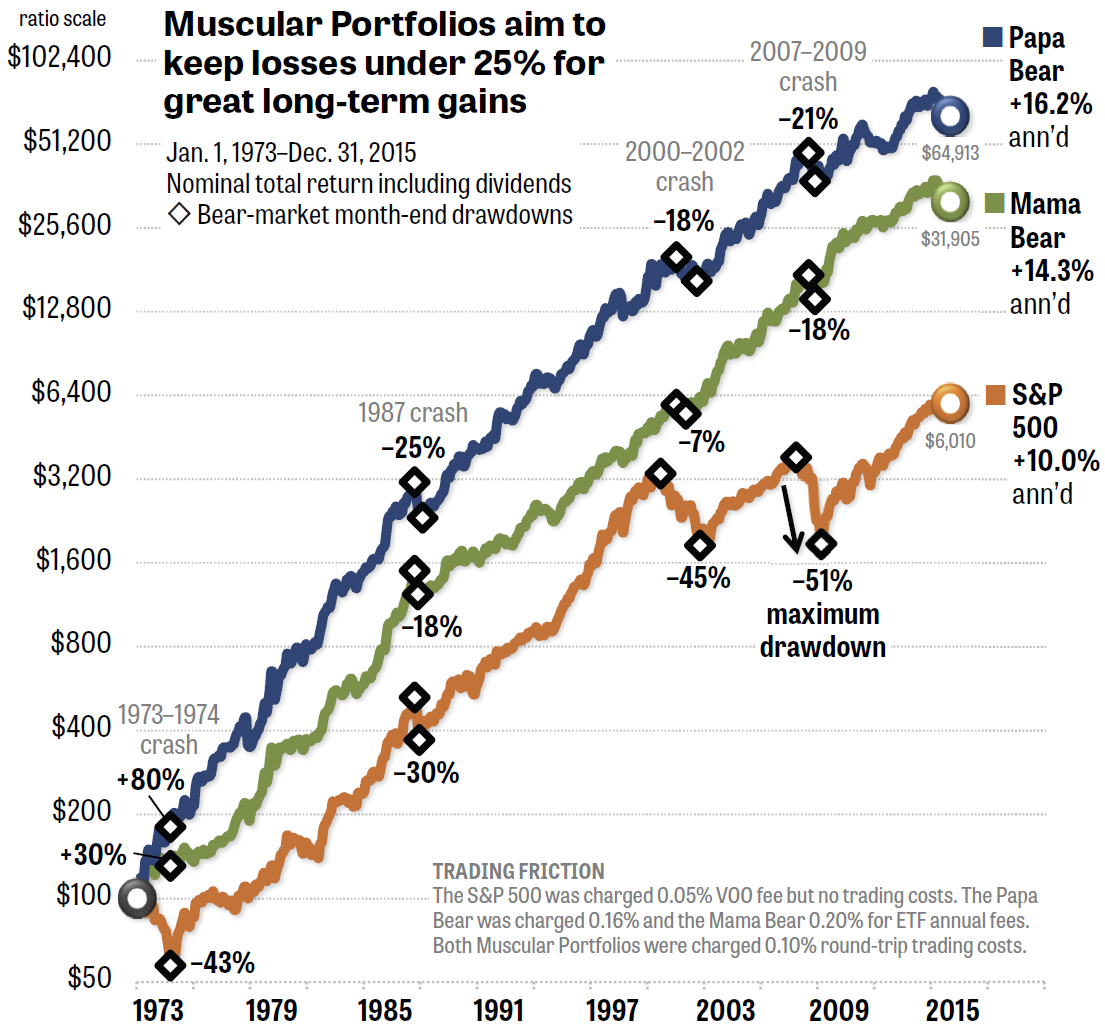 Achieving market-like returns with low volatility — even during the worst market crashes — has been every trader’s dream for decades. Now it’s a reality. Simple strategies can take advantage of ordinary people’s behavioral biases, preventing the formulas from become overused. Two of the strategies from the book Muscular Portfolios are shown at left going back four full bear-market cycles. These two portfolios, called the Mama Bear and the Papa Bear, are examples of “Goldilocks investing”: not too risky, not too tame, just great gains. (Index funds and commission-free trading weren’t available until recently, of course. So the graph was produced by Mebane Faber’s Quant simulator, which subtracts expected trading friction. The program can be requested from Faber as a free bonus upon a $399 subscription to his Idea Farm Newsletter.)
• The solution to the behavior gap is mechanical investing
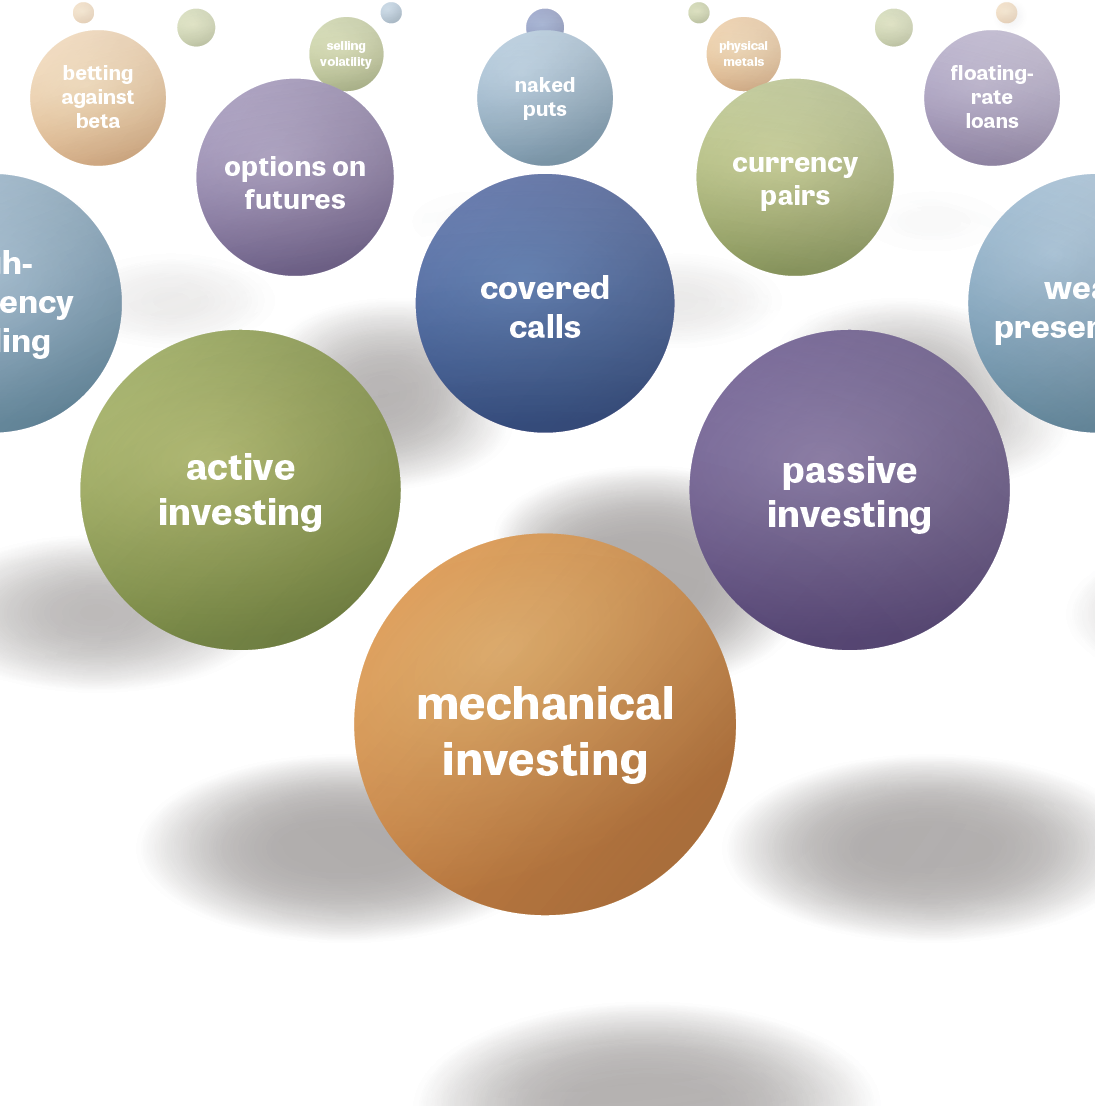 There are many styles of trading, but three are the biggest: Active investing relies on human opinion, which (as we’ve seen) is fallible. Passive investing requires holding index funds in rigid proportions that never adapt to market conditions, thereby exposing investors to huge losses. Mechanical investing means following simple formulas faithfully without overriding them with your own opinions. Muscular Portfolios use “asset rotation” (not market timing) to gradually tilt a trader’s holdings into broad asset classes that are rising and out of those that are falling. It’s well known that computers now consistently beat the world champions of chess, Go, Jeopardy, and other games of skill. If you want to win against the supertraders of the global marketplace, you need the mechanical routines of a computer.
• Track records less than 15 years are statistically meaningless
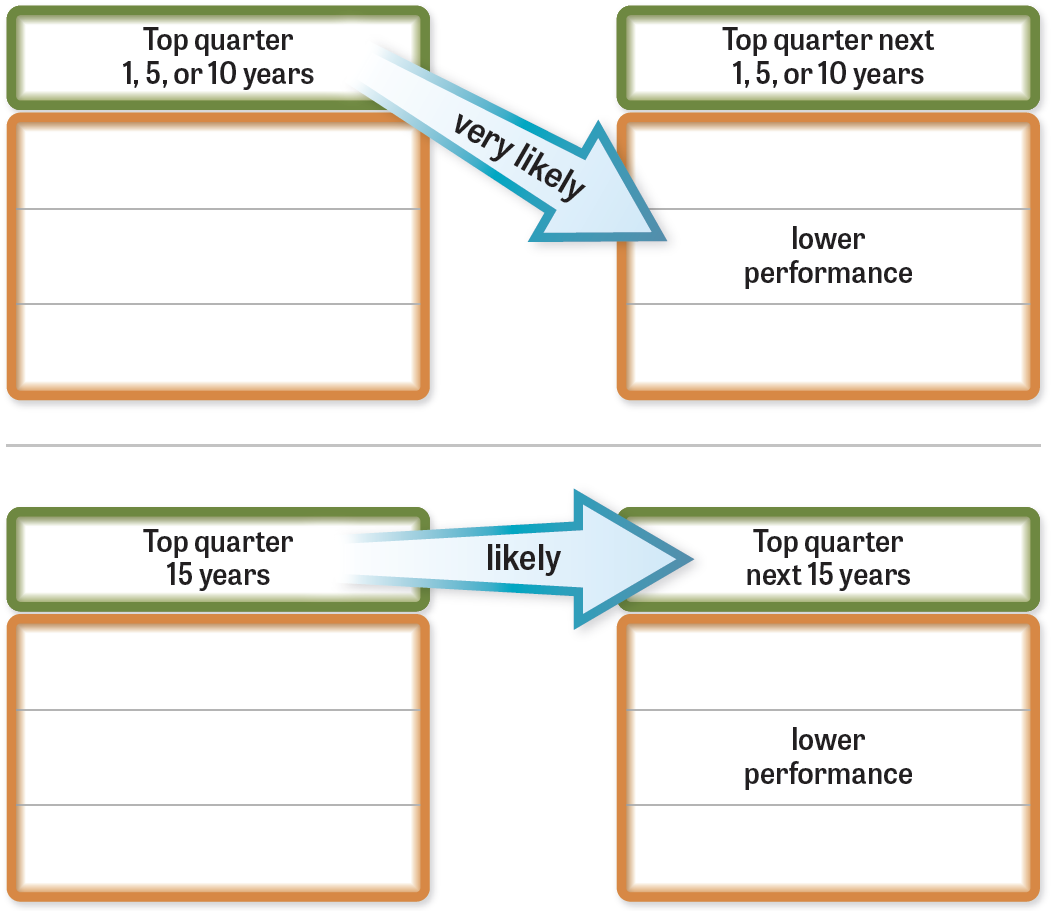 Mark Hulbert, founder of the Hulbert Financial Digest, analyzed the performances of hundreds of investing newsletters over a 33-year period. Being in the top one-fourth of performance for 1, 5, or 10 years had no relationship to whether a newsletter would be in the top fourth in the next 1, 5, or 10 years. Only after a strategy had outperformed for 15 years was it more likely than mere chance to outperform in the next 15 years. Most traders will never be this patient, even though they should rely solely on long track records that are statistically significant.
• Even so-called experts quit good formulas after only 3 years
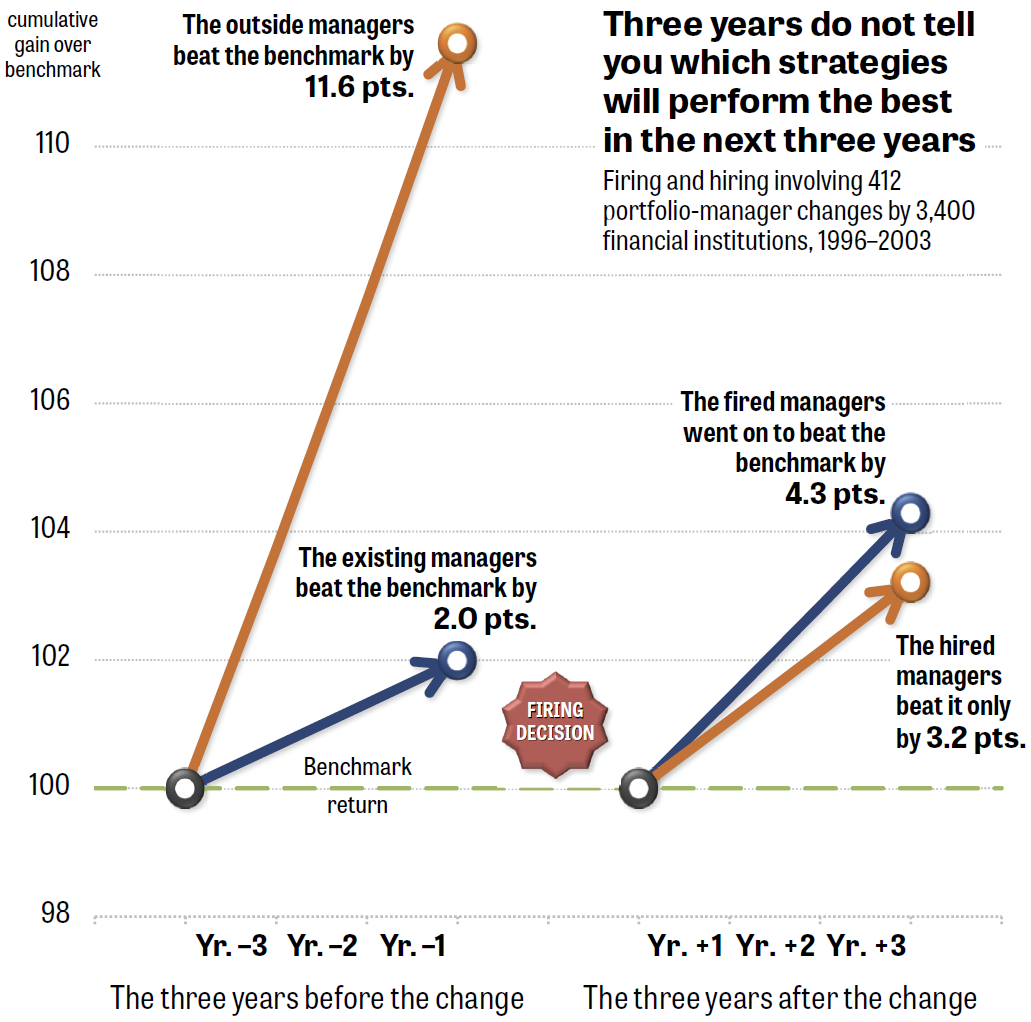 Trading strategies should never be evaluated over periods shorter than one complete bear-bull market cycle. Hulbert and the Vanguard Group separately analyzed the small minority of newsletters and mutual funds that had beaten the S&P 500 over two or more market cycles. Virtually every winning strategy underperformed its benchmark in 5 out of 15 years. Even highly paid pension managers — being human — misunderstand long-term statistical significance. In a survey of 400 top financial institutions that hire outside money managers, 100% of the firms fire advisers who underperform a benchmark for as few as 1, 2, or 3 years. Amazingly, the fired advisers go on to outperform the hired advisers, because the strategies revert to their long-term average performance. Individual traders are even worse at hopping from one strategy to another. The behavioral biases of short-term traders work in favor of long-term traders.
• The S&P 500 is just a number; simple formulas beat it
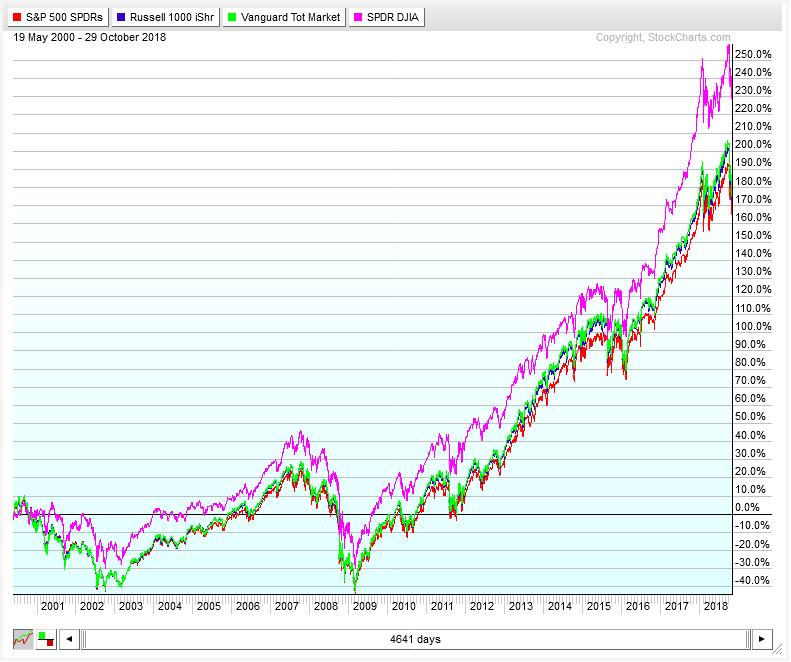 Simple strategies easily beat the S&P 500, because the index is top-heavy and crash-prone. Portfolios that keep bear-market losses small can pull ahead of the S&P 500 consistently, if traders correctly evaluate complete bear-bull market cycles. In the graph at left, notice how actual index ETFs — with either better diversification or lower turnover than the S&P 500 — outperformed from May 2000 through October 2018 (nearly two complete market cycles). The gains for each of the four index funds listed in the next paragraph were:
S&P 500: +165%; Russell 1000: +172%; Total Market: +174%; Dow Industrials: +228%
• Diversification and asset rotation beat active investing
 Why did the simple strategies outperform? For one thing, the S&P 500 (SPY) is less diversified than the large-cap Russell 1000 (IWB) and the total US market of 3,600+ stocks (VTI). Second, low turnover helps: the S&P 500 switches 5% to 10% of its components each year, while the Dow Jones Industrial Average (DIA) changes only about 3% per year. Diversification and gradual asset rotation — not short-term trading — enabled the university endowment funds of Yale, Princeton, Stanford, and others to return 11.2% to 12.3% annualized in the 17 years ending June 2015. In the same period, the S&P 500 returned a mere 5.5% (with a worse drawdown). Active investing is a losing game: more than 93% of US large-cap, mid-cap, and small-cap funds underperformed their benchmarks in the 15 years ending June 2017. “The big money is not in the buying and selling ... but in the waiting.” —Charlie Munger, Warren Buffett’s business partner and trading genius
• Lazy Portfolios are a threat to your wealth
 Lazy Portfolios are strategies that diversify with five or more asset classes but don’t take advantage of gradual asset rotation. They became a fad in the 1990s. MarketWatch.com has tracked the performance of five such portfolios for more than 15 years. In real time, these “static asset allocation” strategies hugely underperformed the S&P 500: 1.13 to 2.56 percentage points annualized! Worse, these Lazy Portfolios crashed in 2002 and 2009 almost as horribly as the S&P 500. All Lazy Portfolios — including robo-advisers and target-date funds — are based on an old theory called the “3-factor model.” (Fama & French, 1992.) This hypothesis claimed that some stocks tend to rise more than others because: (1) they are more sensitive to the market, (2) they are small-cap stocks, or (3) they are “value” stocks. However, the fourth and most important factor of all — momentum — wasn’t academically proven until one year later.
• The timeless factor — momentum — outshines all others
 Traders have known for hundreds of years that “the trend is your friend.” But this rhyme was finally confirmed with mathematical rigor in 1993. Momentum is a timeless, worldwide principle: Assets that have risen in price in the past 3 to 12 months have good statistical odds to rise for one more month. (Jagadeesh & Titman, 1993.) This doesn’t allow us to predict tomorrow’s prices or next year’s prices, but momentum does tend to predict next month’s gains. Adding this powerful element to the inadequate 3-factor model produced the superior “4-factor model.” (Carhart, 1997, bottom photo.) Researchers gradually embraced the new findings, writing: “The premiere anomaly is momentum.” (Fama & French, 2007, top photo.) Academics have studied other possible factors but repeatedly come back to the champion: “All models that do not include a momentum factor fare poorly.” (Fama & French, 2014.)
• The small-cap and value factors fade in and out
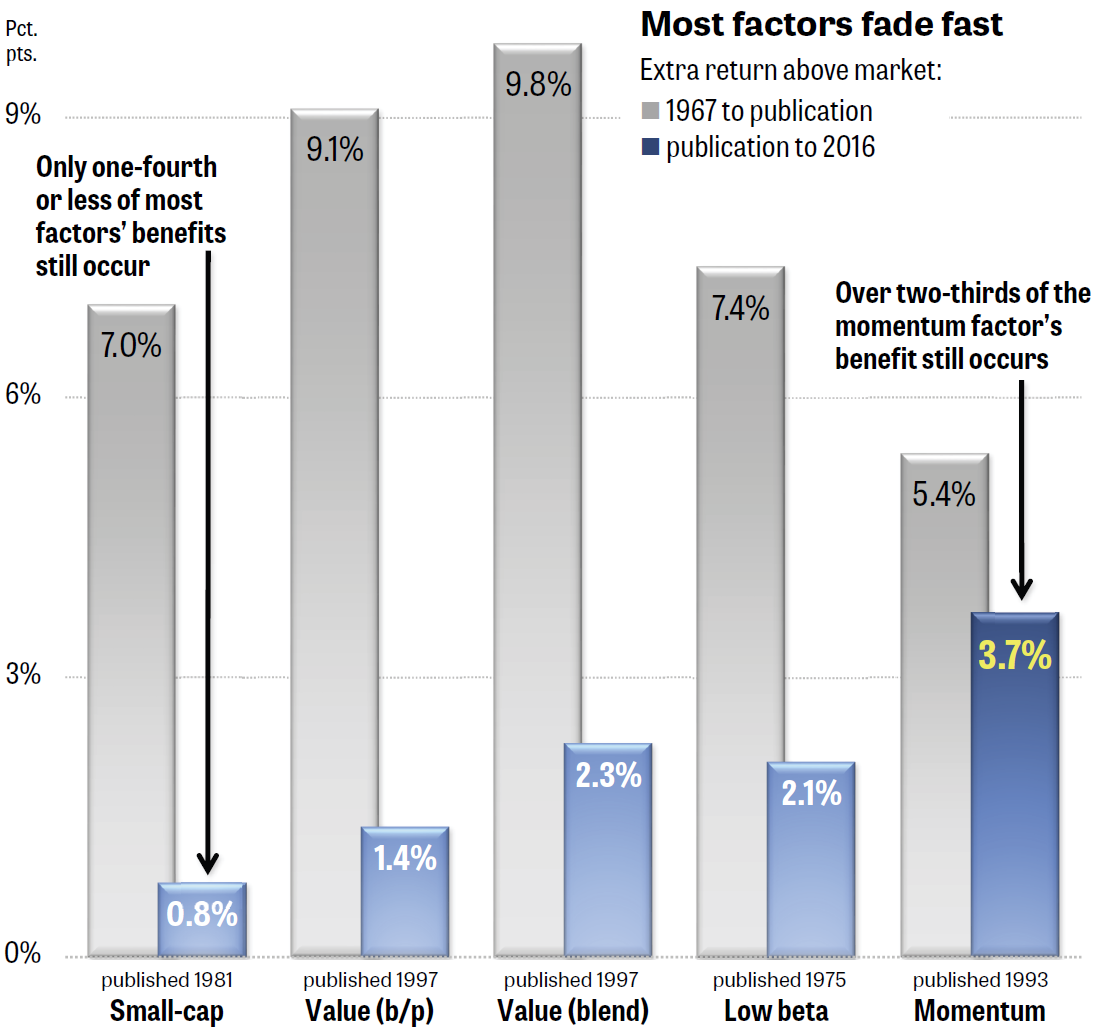 Just when momentum was being proven academically, the other factors began fading out. An AQR study (graph at left) showed that, like many other “discoveries,” the small-cap and value factors largely disappeared after being revealed in financial journals. Researchers found that the original small-cap studies were misleading, due to “survivorship bias” and incomplete data. (Hsu & Kalesnik, 2014.) Meanwhile, value stocks haven’t beaten growth stocks in the US since 1992. (The annualized returns of US value and growth 1993–2017 were a virtual tie at 9.65% and 9.57% — an insignificant difference.) Lazy Portfolios, robo-advisers, and target-date funds may never learn to use momentum. But Muscular Portfolios employ the factor effectively. Asset rotation gradually tilts your portfolio toward small-cap value, small-cap growth, large-cap value, or large-cap growth, whichever asset has the best odds of going up in the next 30 days. Muscular Portfolios are not chained to debunked “static” theories.
• Use momentum with asset classes, not individual stocks
 What are asset classes? They are mental divisions of the world’s investable securities into categories. Constructing portfolios using a dozen or so asset classes gives us all the diversification and momentum we need. Low-cost exchange-traded funds (ETFs) now exist for large-cap and small-cap equities, real estate, commodities, precious metals, bonds, and more. The most popular index funds have huge liquidity, which keeps your trading costs close to zero. Trends in asset classes are also more predictable than individual stocks. “The stocks generating the largest momentum returns are the smallest, less liquid ones having higher trading costs,” explains financial adviser Gary Antonacci. “Transaction costs negate much of the momentum profits of individual stocks.”
• If you buy only stocks, you’re missing big gains
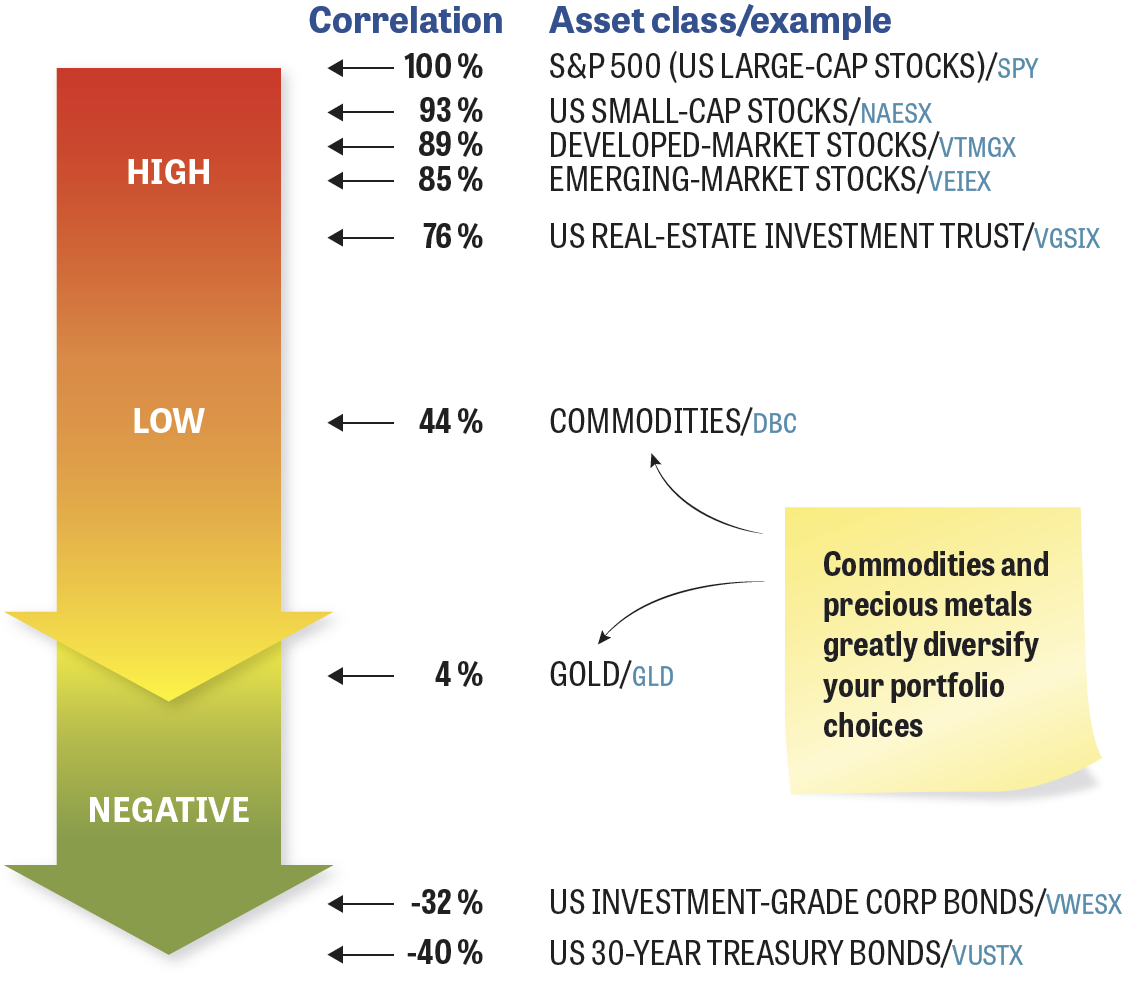 “ETFs have revolutionized the ability to take advantage of intermarket relationships,” says StockCharts’ chief technical analyst John Murphy. For the first time in history, exchange-traded funds deliver 99% of the return of any global asset class without the unpredictability of individual securities. A 99% tracking rate is much better than most humans can do, using fallible opinions to try to pick winners. The findings of 21st-century Nobel laureates in economics give us simple, mechanical rules to follow. ETFs let us easily enjoy the benefit of “hard assets” with low correlations to the S&P 500, such as real estate, commodities, and precious metals. (See chart at left.) We can now combine index funds in highly liquid, profitable strategies that can be given away free with no fear of overuse.
• A website reveals the picks in real time, free of charge
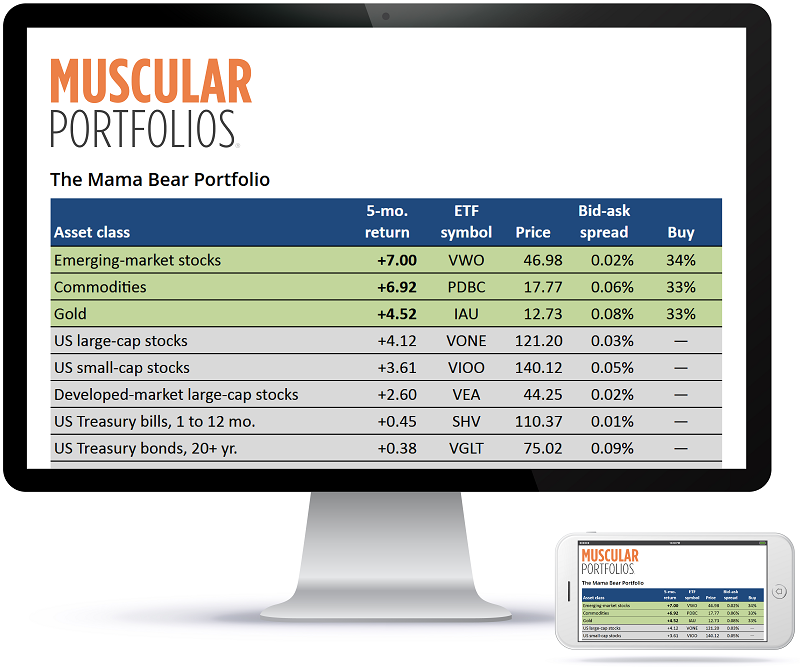 MuscularPortfolios.com is the first website to rank the asset classes that have the best odds for success in the next month for owners of 401(k), IRA, and other brokerage accounts. The rankings are provided totally free, and no registration is required. The portfolios are “clones” (fully disclosed translations) of strategies that have been tracked for years since their development by such financial experts as Jack Bogle of Vanguard, Mebane Faber of The Ivy Portfolio, and Steve LeCompte of the CXO Advisory Group. The index fund rankings are updated every 10 minutes during market hours. This is just the first of numerous websites that will rise up, freely giving people who discover mechanical investing the diversification and momentum information they need.
• Only nine changes per year — and tax efficiency, too
 Based on 43 years of actual asset-class history, a Muscular Portfolio — like those shown above — requires a position change only 9 months out of every 12, on average. That’s perfect, not just for 401(k) account owners, but also for any trader who wants market-beating gains without beating your head against your computer every day. Even better, more than 50% of the sells of the Papa Bear Portfolio qualify as long-term capital gains, not short-term (which are taxed at higher rates). That makes Muscular Portfolios attractive in taxable accounts, even for people in high tax brackets. In trading, it’s not how much you make, it’s how much you keep after taxes.
• The Index Investing Revolution is disrupting Wall Street
 The launch of freely available formulas for market-like returns with low risk is a serious threat to Wall Street professionals. Smooth talk won’t enable them to keep charging their high fees forever. Just as the Internet eliminated most travel agents years ago, the Web is now making security-picking advice free and easy. The latest 21st-century science shows us how to easily extract the maximum signal from all the market noise. As far as we can determine without a crystal ball, strategies such as the Papa Bear Portfolio will beat — during the next complete bear-bull market cycle — any other strategy that:
- Is fully disclosed (no secret formulas allowed)
- Requires no more than one change (under 15 minutes of work) per month
- Is supported by a free website revealing the picks with no registration required
- Never loses more than 20% to 25%, even in 50% market crashes
Hey, big Wall Street banks! If you think you have a better strategy, just post your picks on your very own totally free website. We’ll see who wins in the next market cycle! (Most of my personal wealth is in Muscular Portfolios, so my money is where my mouth is.)
• Things to do today
- Order the book Muscular Portfolios from Amazon or B&N
- Get monthly updates by subscribing to the free newsletter at MuscularPortfolios.com
- Follow my Twitter feed @Brian_Livin, which announces all of my columns — and more!
Thanks for your interest. Let’s work together to bring personal trading into the 21st century!
With great knowledge comes great responsibility.
—Brian Livingston
Send story ideas to MaxGaines "at" BrianLivingston.com
