Examining the top gurus of the last 18½ years reveals numerous periods — 1, 2, and 3 years long — when they badly lagged the market. Could you wait? • Every superior investing strategy enhibits ‘cold streaks’ as well as ‘hot streaks.’ Beating the market requires doing something the market isn’t. Understanding tracking error gives us the only way of standing it.
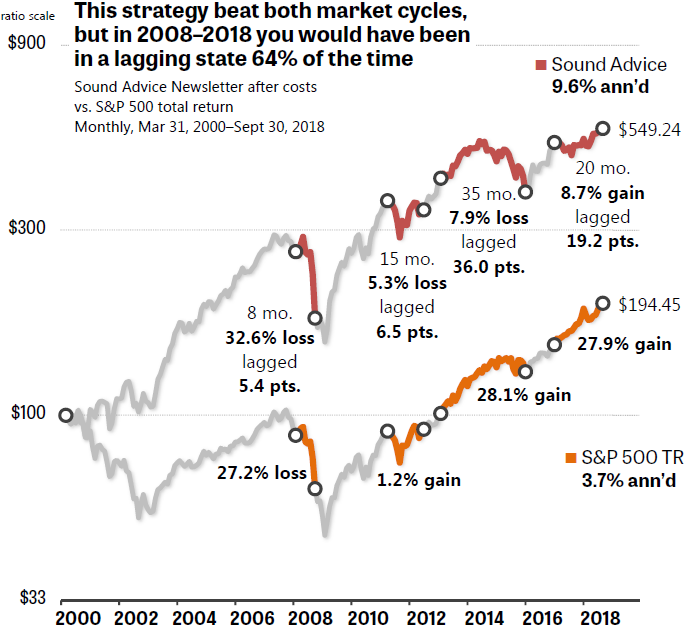
Figure 1. The Sound Advice Newsletter outperformed the S&P 500 in both of the last two market cycles. But in the latest regime, you might have felt like the strategy had “stopped working” if you compared returns during 64% of the months along the way.
• Parts 1, 2, 3, and 4 of this series appeared on Feb. 5, 7, 12, and 14, 2019. •
In response to readers’ requests, I’m publishing monthly performance graphs today for all six winners of Mark Hulbert’s 2018–2019 Honor Roll. The honorees are those investing newsletters or services that have outperformed all others, based on Hulbert’s tracking, in both bear and bull markets. (This year’s winners did an outstanding job of surpassing the S&P 500 in both of the last two bear-bull market cycles. But beating the index is not Hulbert’s requirement to make the list, only relative outperformance vs. all other newsletters.)
Let me reiterate that I’m not recommending any of these newsletters. I’m showing you their actual month-by-month performances here as a way of illustrating the findings of a Hulbert study and a Vanguard white paper. As I explained in Part 2 of this series, both of these studies showed that virtually every newsletter and mutual fund that exceeded the market’s return over the long term perversely subjected investors to serious periods of underperformance for five years or more. There’s no such thing as a superior strategy that beats the index every month or even every year. If such a beast existed, it would quickly become overused and stop working.
Figure 1 demonstrates this fact with one of the Honor Roll winners. The Sound Advice Newsletter outperformed the S&P 500 in both of the past two bear-bull market cycles. In the latest cycle, SA’s gain was 88.5%. That barely squeaked past the index’s 88.1% — but a win is a win. (Note: All numbers in my column are total return, reflecting the reinvestment of dividends. Hulbert subtracted broad estimates of expenses from each newsletter’s return but not from the S&P 500.)
The bad news is that it would have been very tough for mere mortals to have stuck with Sound Advice from 2007 on. As shown in Figure 1 with red lines, your portfolio would have lagged the market between a worrisome 5 percentage points and a horrendous 36 percentage points, if you’d compared your account’s performance against the S&P 500 during four periods as lengthy as 1, 2, or 3 years. Imagine the index being up 28.1%, but your portfolio being down 7.9% during three years of the 20-teens’ roaring bull market! That would exhaust the patience of many people on that newsletter. But Sound Advice (like the other Honor Roll winners) had “hot streaks.” These made the advisers pull ahead of the index over the only period that proves anything: a complete market cycle.
As I explained in my Muscular Portfolios summary, 100% of financial institutions that hire outside money managers fire them after as few as three years of underperformance. About 40% of the institutions fire lagging managers after just two years, and another 40% after as little as one year! Individual investors are just as skittish about their advisers, if not worse.
The main conclusions from my study
After I analyzed the month-by-month performances of the Honor Roll winners, some conclusions became clear. The reasons I can’t recommend any of the advisory newsletters are many:
- As explained in my summary, academic research has proven that we humans have a “behavioral gap.” Individual investors gain at least 2 percentage points less than whatever funds they happen to invest in. This is caused by people bailing out when the market goes down, staying out of the market for months or years, and then getting back in after missing significant gains.
- There seems to be a “behavioral pain point,” which varies for every person but hovers around a 25% or 30% loss. After that, individuals start to liquidate their holdings, at huge detriment to their long-term performance.
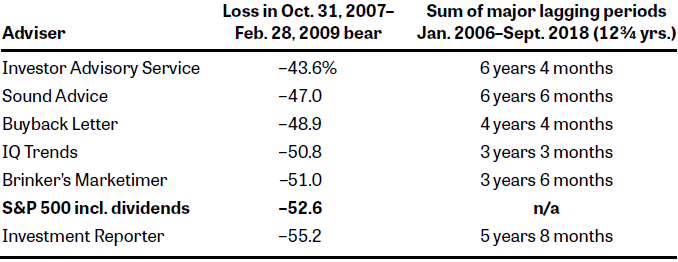
Figure 2. Every newsletter subjected investors to losses far beyond the 25% “behavioral pain point.” And each newsletter had unpredictable “cold streaks” that lasted a total of three to six years or more over just the 12¾ years beginning in 2006.
- As Figure 2 shows, none of the newsletters came anywhere close to protecting against crashes, slashing followers’ portfolios 44% to 55%. Those losses are far past the level at which many individuals would bail out. Even the self-named “market timer” newsletter — one of the best in Hulbert’s rankings — didn’t prevent readers from losing more than 50% of their investment accounts. Get me outta here!
- Today’s low-cost exchange-traded funds make it easy for investors to reap 99% of the gains from any asset class you like: small-cap value stocks, large-cap growth stocks, commodities, precious metals, bonds, etc. There’s no longer any need for us to agonize over buying individual stocks or to limit ourselves to the US equity market, with its crash-prone behavior.
- Virtually all 401(k)-type programs prohibit account holders from buying individual stocks, only a set of approved funds. Even people with full control over IRAs or Roths may not be inclined to buy and monitor a list of ticker symbols, each with its own idiosyncratic risks.
- The Honor Roll ratings reflect only one to two dozen newsletters that pay to be included in HulbertRatings.com. This naturally attracts stronger newsletters that are likely to have better track records.
- I didn’t show in today’s graphs any “cold streaks” shorter than six months in length or less than 2 percentage points of underperformance. If I had shown every month of underperformance with a red dot, almost half of the fever lines would be red. All six newsletters underperformed the S&P 500 in approximately 40% of the months in the study period. (The range was amazingly tight: each newsletter’s monthly gain or loss lagged the index in 38% to 42% of the months — not a significant difference.)
- You can’t see these things coming. My study failed to turn up any way to predict when an advisory newsletter would end a “hot streak” and begin a “cold streak.” (The advisers themselves can’t tell, so how could you?) Nor was it possible to predict how long a streak would last. This kind of uncertainty is hard for individual investors to stomach.
- I like Muscular Portfolios because they solve the uncertainty. A Muscular Portfolio is always invested in three different asset classes. This provides diversification and protection against crashes. A portfolio that’s this diversified is guaranteed to underperform the S&P 500 in bull markets. You can tolerate this, because you know it going in! Only during bear markets do Muscular Portfolios surpass the index. But that’s enough to beat the index over complete market cycles. As I illustrated in my Jan. 3 piece, the Mama Bear Portfolio outperformed the S&P 500 in the current bear-bull market cycle (Oct. 31, 2007–Dec. 31, 2018) by more than one percentage point per year: 7.67% annualized vs. 6.58%. You can have market-like returns with bond-like peace of mind.
Use today’s graphs to understand and master tracking error
My graphs for all six Honor Roll winners, such as Figure 1, use a ratio scale (also called a semilog scale). When two portfolios both have the same gain, such as 5%, a ratio scale shows the rise with two lines that have the same slope. This makes comparisons easy. It doesn’t matter which portfolio happens to hold more dollars than the other.
The vertical dollar amounts on the left axis of a ratio scale increase by multiplication. In today’s case, each horizontal gridline represents a dollar amount that’s 3 times the gridline below it. The labels on the vertical axis increase like so: $100, $300, $900, and so forth. In a linear scale, the dollar amounts are additive: $100, $200, $300, $400. A ratio scale should be used whenever one portfolio quadrulples in value or more (growing from $100 to $400, for example).
By contrast, I used linear scales to illustrate the Investment Reporter in Part 2 of this series and the Investor Advisory Service in Part 4. You can look back at those illustrations and compare them with the ratio scales in today’s graphs.
You’ll notice that all of the six newsletters beat the 2000–2007 bear-bull market cycle easily. The IQ Trends service actually gained 20.8% in the 2000–2002 bear, while the S&P 500 lost 46.3%. The other newsletters didn’t post such gains, although they had very tolerable losses in the same bear period: only –0.8% to –15.6%. To their credit, their outperformance in the 2000–2007 cycle was not the reason why all six beat the market over the entire 18½-year study period (2000–2018).
All six services also outperformed the S&P 500 in the Oct. 31, 2007–Sept. 30, 2018 bear-bull market cycle. (This year’s Honor Roll database terminates on Sept. 30, not Dec. 31.) As I noted previously, Sound Advice eked out a win of just 40 basis points, boasting a gain of “only” 88.5% in that regime. But the other newsletters printed superior gains of 118.7% to 222.4% in the same period (by Brinker’s Marketimer and the Investor Advisory Service, respectively.)
Gains like these are not certain to continue. In a separate study, Hulbert showed that an adviser needs to perform in the top one-fourth of all advisers for 15 years for there to be a 50% probability that the adviser will also be in the top one fourth in the next 15 years. Even a decade-and-a-half of outperformance gives you only a coin flip’s chance that it will be repeated.
To use the existing data set as an example, Sound Advice was statistically tied with the Investment Reporter for the best performance of all six newsletters in the 2000–2007 market cycle (gains of 191.45% vs. 196.82%, respectively). But Sound Advice delivered the weakest performance of the six in the 2007–2018 cycle. Stick with simple, low-cost, multi-asset ETF strategies that can be followed in a 401(k) or any kind of investment account.
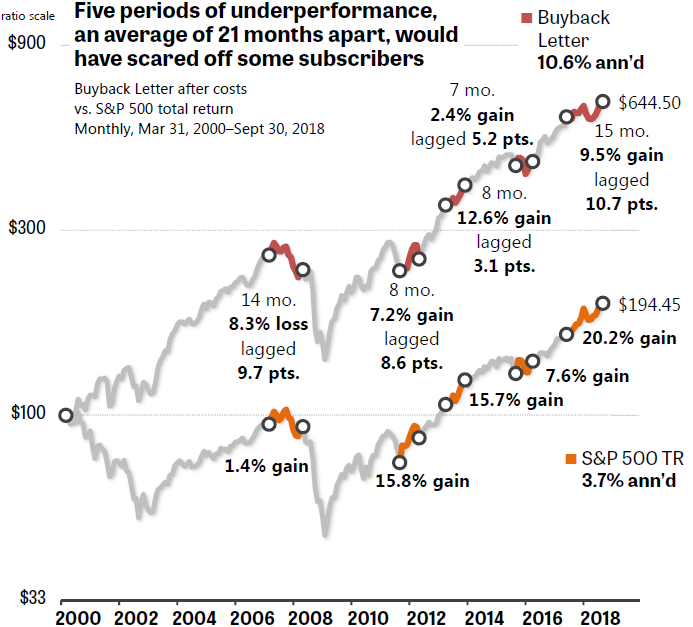
Figure 3. Just after the Buyback Letter had a period of good performance, it subjected followers to underperformance in a following period, lagging the S&P 500 by 9 to 11 percentage points in most cases.
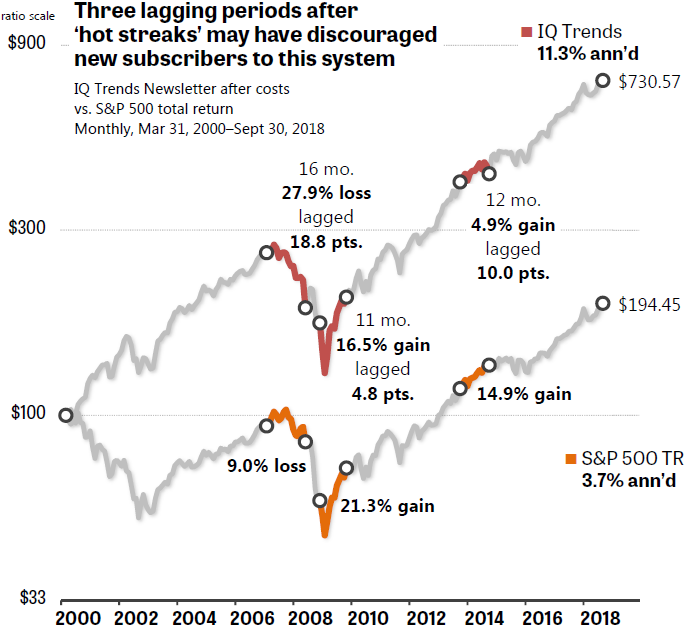
Figure 4. IQ Trends had three long periods of underperformance, lagging the index by 5, 10, or 18 percentage points on those occasions.
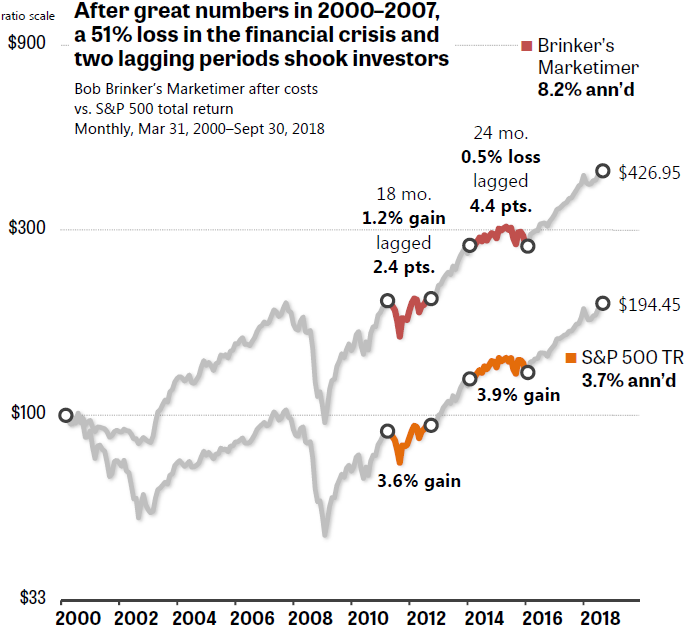
Figure 5. Bob Brinker’s Marketimer had the fewest distinct “cold streaks” of the newsletters in this study — two — but one lasted for a year-and-a-half and the other for two years, long enough to convince some people that the system had “stopped working.”
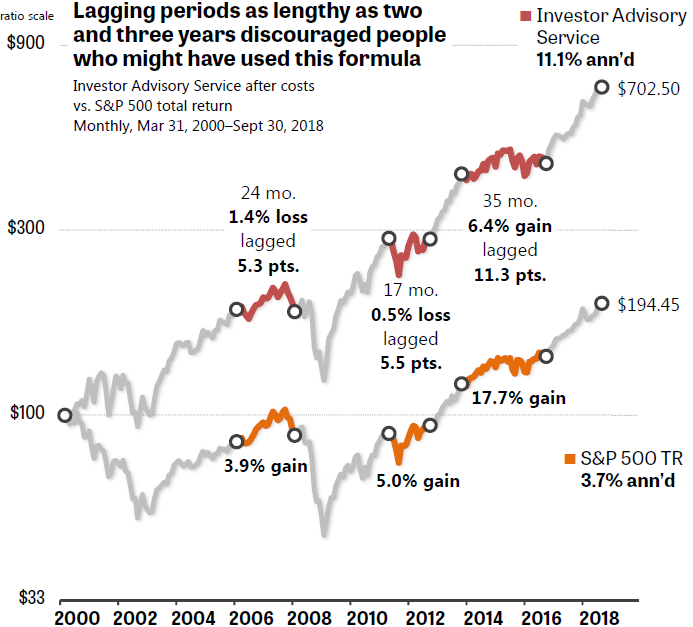
Figure 6. The Investment Advisory Service had only three major periods of underperformance, but in two of those cases the strategy actually lost money while the S&P 500 made money.
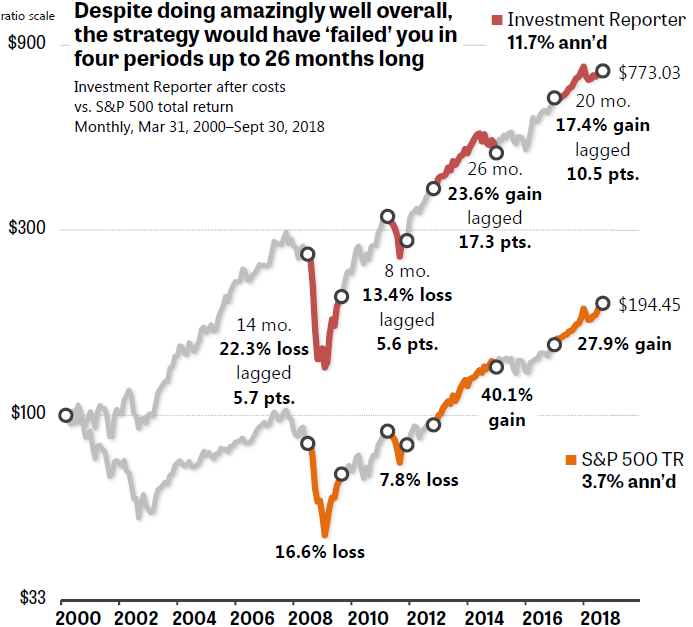
Figure 7. The Investment Reporter had the best overall return in the Honor Roll (11.7% annualized). But its four major periods of underperformance fiendishly occurred immediately after “hot streaks,” exactly when new followers would have signed up.
With great knowledge comes great responsibility.
—Brian Livingston
Send story ideas to MaxGaines “at” BrianLivingston.com
