The Dow Jones Industrial Average has beaten the S&P 500 for decades. But people love the S&P. Why? Because they don’t know how to use tracking error. • Over the past 21 years, the DJIA has delivered 32% more gain than SPY. But traders shun the Dow. (SPY has 22 times the trading volume of DIA, the ETF that mirrors the Dow.) Mastering tracking error enables you to put more money in your pocket.

• Parts 1 and 2 of this column appeared on Feb. 5 and 7, 2019. •
As we saw in Part 2 of this column, virtually every US investment newsletter and equity mutual fund that beat the S&P 500 in recent decades has had periods of 5 years when each strategy underperformed the index.
Would you tolerate a strategy’s underperformance for half a decade to determine whether it’s “not working”? Most investment professionals wouldn’t.
The research service FT Remark surveyed 400 senior executives of pension funds and other large financial institutions that hire outside money managers. The study found that 100% of the firms terminate any outside manager who underperforms a benchmark during as little as a three-year period. A shocking 40% of institutions fire any outside manager who underperforms for a single year!
The bad effects of this short-termism are severe. More than 3,400 financial institutions were studied by professors from Emory University and Arizona State. The researchers analyzed over 400 firing and hiring pairs these firms carried out during an eight-year period. You guessed it: In the three years after termination, the fired money managers outperformed the ones the institutions had hired to replace them!
The managers whose contracts were suspended had merely experienced the normal amount of tracking error that any superior strategy always has with its benchmark. People apparently need to learn this the hard way.
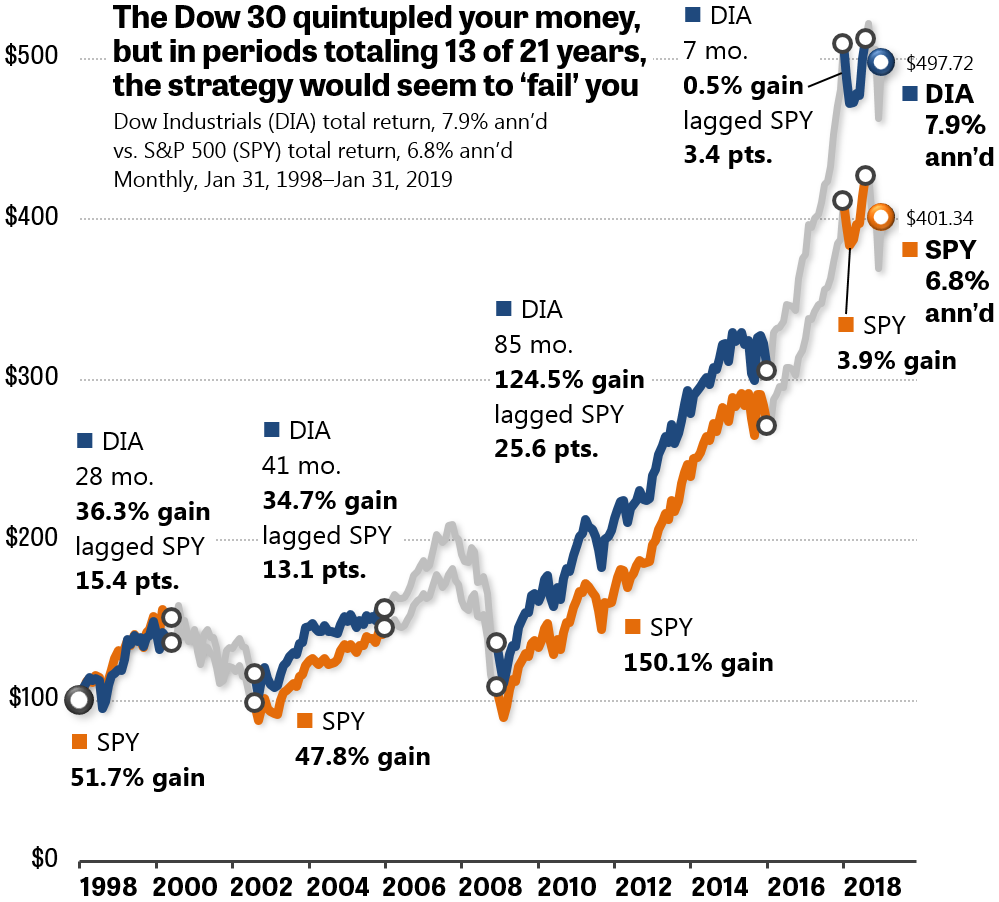
Figure 1. The Dow Jones Industrial Average gave you 32% more gain than the S&P 500 (including dividends), but the long periods of to-be-expected underperformance keep most individual investors from taking advantage of the boost.
Previously, we saw a graph of the Investment Reporter newsletter, an advisory service tracked by HulbertRatings.com. The newsletter (after expenses) tripled the annualized return of the S&P 500, 11.7% vs. 3.7%, during the past 18½ years. And yet the newsletter’s advice subjected its followers to four bouts totaling almost six of those years during which the portfolio lagged the S&P 500 by several percentage points.
This doesn’t occur only with investment newsletters and equity mutual funds. Underperformance of an index for long periods of time — years — is a requirement for every strategy that beats the S&P 500. Winning at investing means faithfully following a formula that is almost guaranteed to exhibit tracking error: hot streaks and cold streaks.
Figure 1 illustrates this with the Dow Jones Industrial Average (DJAI). You almost never hear this fact, but the Dow, with its 30 hand-picked stocks, has outperformed the S&P 500 for decades. (All return calculations include the reinvestment of dividends.)
You think it’s hard to beat the S&P 500? The truth is that it is complex formulas that lag the index. The promoters of the latest investment fads and fashions have “curve fit” their strategies to past data that will never occur again. Only very simple formulas that take advantage of classic market behaviors can succeed in returning more than a benchmark.
It’s obvious from a glance at Figure 1 that the Dow 30 walloped the S&P 500 over the past 21 years. On an initial investment of $100, the Dow gave you a gain of $397.72 (for a total account balance of $497.72). The industrials quintupled your money. The S&P 500 handed you only $301.34. The Dow’s annualized return was 1.1 percentage points more than the S&P 500: 7.9% vs. 6.8%.
(Note: These returns are calculated from two ETFs that deducted actual expense ratios from their prices along the way. Tracking the S&P 500 was SPY, and tracking the Dow was DIA, which began trading on Jan. 14, 1998.)
The big numbers the Dow racked up came about precisely because it had cold streaks and hot streaks. This variability keeps many people from buying into DIA, allowing it to continue to outperform over the long term. Here are its four periods of underperformance:
- Jan. 31, 1998, through June 30, 2000: For more than two years after DIA began trading, the Dow underperformed the S&P 500 by 15.4 percentage points.
- Aug. 31, 2002, through Jan. 31, 2006: After finding its feet, DIA almost immediately began lagging again, this time by 13.1 points over 3 years and 5 months.
- Dec. 31, 2008, through Jan. 31, 2016: The ETF’s longest cold streak lasted more than seven years, as the Dow underperformed the S&P 500 by 25.6 points.
- Jan. 31, 2018, through Aug. 31, 2018. The Dow lagged during more than half of the most recent calendar year, trailing the S&P 500 by 3.4 points.
If you add up those four time spans, you see that the Dow’s underperforming periods totaled more than 13 out of the 21 years in Figure 1. That’s almost 64% of your investing history. How’re you holdin’ out, champ?
Since we humans are not computers, we experience time minute by minute, or at best month by month. In monthly terms, if you checked your brokerage statement every 30 days, you’d have found that the Dow underperformed the S&P 500 almost exactly half the time (49.21% of the 252 months).
That’s a win-loss ratio most people will never tolerate. But that kind of variability is exactly what makes a strategy beat the market. A winning formula doesn’t track any benchmark very well. Instead, the plan experiences cold streaks — but they’re followed by hot streaks that wind up outperforming the index in the long term.
Train yourself to use tracking error to profit
What’s the answer for long-term investors? We don’t want to deliberately pick investing strategies that underperform all the time. Absolutely not! We want strategies that will outperform during the long periods that are meaningful for us: (1) our working career, when we’re adding money to our accounts, and (2) our financial freedom, aka retirement, when we’re living off the healthy balances we created.
The most important step is to learn to evaluate investing strategies only over complete bear-bull market cycles — more than one, if possible. On average, one bear and one bull occurs every eight years. Most of us will experience several of these “primary cycles” during our lifetimes.
The other step is to understand that superior investing strategies always underperform the S&P 500 for years at a stretch. From time to time, the index is simply the strongest asset class out there.
Should you now go out and sink all your money into the Dow? Of course not. It crashed almost 50% in the 2007–2009 financial crisis, just like the S&P 500. That’s the kind of soul-crushing loss no investor should endure. You don’t need heart attacks on the road to good long-term performance.
In my Muscular Portfolios summary, I explain that the book’s model portfolios are expected to underperform the S&P 500 in every bull market. That’s the opposite of the brainwashing you receive from the business media: “Beat the market! Beat the market!” By contrast, the gentle shadowing of a diversified portfolio during a bull market — steady growth, but a safe distance away from the crash-prone index — removes the worry and the uncertainty of comparing your account against an impossible ideal every month. Only during a bear market does a Muscular Portfolio surpass the index. But that “slingshot” effect is more than enough for you to outperform the benchmark in a full primary cycle.
As we saw in my Jan. 3, 2019, column, the Mama Bear Portfolio — over the past 11 years, the last three years using real-money tracking — beat the S&P 500 total return, 7.67% annualized vs. 6.58%. That’s more than one whole percentage point annualized (like the outperformance of the Dow in Figure 1, but without the crashes). You can compound that extra money in your account in years to come, or spend it to support a comfortable lifestyle when you’ve finally said good-bye to your last boss.
In further parts of this series, we’ll see more examples of how we can exploit tracking error and make the counter-intuitive math work for us instead of against us.
• Part 4 and 5 appear on Feb. 14 and 26, 2019.
UPDATE 2019-02-13: A label in Figure 1 originally stated on Feb. 12, 2019, that the DJIA had gained 24.5% while the S&P 500 gained 50.1% from Dec. 31, 2008, through Jan. 31, 2016. The gains were actually 124.5% and 150.1%, respectively, as shown in the revised Figure 1 above. The graph lines and the descriptions in the text of the column were and are correct.
With great knowledge comes great responsibility.
—Brian Livingston
Send story ideas to MaxGaines “at” BrianLivingston.com
