When does a tortoise beat a hare? When it’s an investing strategy that lags the market for months or years but keeps chugging along and wins in the end. • Separate studies by the Hulbert Financial Digest and the Vanguard Group reveal that market-beating funds underperform the S&P 500 for five years or more. Tracking error can make you give up on a winning formula — unless you know the secret.

Figure 1. Like a tortoise, a winning formula can fall behind the S&P 500 for years at a time but produce superior gains over the long term. Photo illustration by James Steidl/Shutterstock.
• Part 1 of this column appeared on Feb. 5, 2019. •
As we’ve seen, the US equity market is acting very toppy. Whether we like it or not, we’re heading into an inevitable bear market sooner or later. At turning points like this, our favorite investing systems can become unreliable. What’s an investor to do?
The answer is to take a long-term view. Since the S&P 500 crashes 30% or more every 10 years, on average, buy-and-hold strategies tend to force people out of the market when the pain of losses compels them to liquidate at the worst possible time. But how are we to know which defensive formula to follow when our preferred investing plan doesn’t always outperform the benchmark?
Mark Hulbert, the founder of the Hulbert Financial Digest, and the Vanguard Group, creator of the first index fund, conducted separate studies that show how much leeway we must give any investing strategy that we expect to perform well.
Hulbert analyzed a few dozen investment newsletters he’d tracked in real time from 1908 to 2014 (a period of 34 years). Every one of the newsletter editors who’d managed to outperform the S&P 500 over that span lagged the index “in more than half of the five-year periods since 1980,” his study showed.
“It’s a rare investor who is willing to stick with a strategy after five years of market-lagging performance,” Hulbert notes.
The Vanguard study examined a much larger group of professionals: more than 1,500 actively managed US equity fund managers over a period of 15 years (1998 through 2012). Virtually every one who outperformed the broad market lagged his or her benchmark for at least 5 out of those 15 years, according to the group’s white paper.
Turn tracking error into your friend instead of your enemy
Fortunately, an understanding of tracking error is all we need to make it work for us and not scare us away from the best long-term investing strategies.
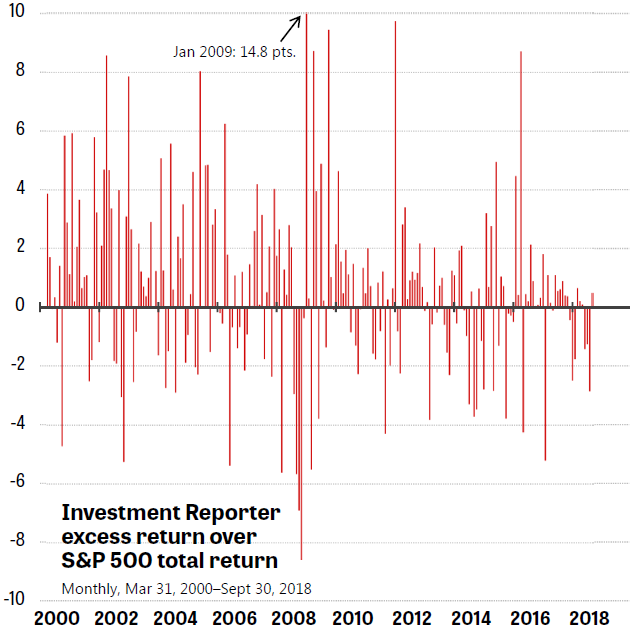
Figure 2. The strategy that performed the best since March 2000 at HulbertRatings.com varies enormously from the S&P 500’s total returns. Each of the newsletter’s monthly gains or losses ranged from 14.8 percentage points above the index to 8.6 points below. Source: HulbertRatings.com.
The Hulbert Financial Digest was acquired by CBS MarketWatch in 2002. Dow Jones & Co. subsequently purchased the website in 2005 and renamed it simply MarketWatch. The digest continued until 2016, when Dow Jones closed it. Since that time, Hulbert has continued to maintain a smaller tally of investment newsletters at HulbertRatings.com. In order for the website to avoid carrying advertising, only financial advisers who pay a fee are included in the ratings. This tends to attract publications whose performance records are worth crowing about.
Each year, Hulbert publishes an Investment Newsletter Honor Roll. The latest edition covers an 18½-year period from Mar. 31, 2000, through Sept. 30, 2018. That span of time neatly encompasses two bear markets (the 2000–2002 dot-com crash and the 2007–2009 financial crisis) as well as the two lengthy bull markets that followed.
Figure 2 shows the monthly difference between the total return of the S&P 500, including dividends, and the gain of the newsletter that happened to perform best during the latest 18½ years: the Investment Reporter. Don’t rush out and buy that publication just yet. It’s likely that random chance played some role in the rankings, and there’s no guarantee that this particular periodical will repeat its recent performance soon.
The winner of the race this year, however, does teach us some important points. During the term of the study, the S&P 500 total return was 3.66% annualized. The Wilshire 5000, which includes virtually every tradable stock in the US, returned 5.4%. But the advice of the top-performing newsletter returned an impressive 11.7%. Think about that top score the next time someone claims you can easily make 100% a year in the market. Even the best of the best produce results that barely break into the low double digits. (To compute each newsletter’s returns, Hulbert records the prices of each security the day its subscribers could have acted on the information. He subtracts a healthy chunk of change to simulate transaction costs.)
The vertical columns in Figure 2 depict the wide swings the Investment Reporter experienced, compared with the monthly market returns. In the month of January 2009 — the final weeks of the housing-bubble collapse — the newsletter’s advice earned its followers 6.2%, while the S&P 500 lost 8.6%. The difference is 14.8 percentage points, as shown at the top of Figure 2. This is the greatest variation of any month in Hulbert’s data. (I’ve highlighted the 14.8 number with a callout, in order to keep my charts of the six Honor Roll newsletters at the same scale of plus 10 points to minus 10 points. We’ll see those charts later.)
How much pain does a successful strategy cause us?
OK, so the Investment Reporter has a lot of tracking error, to put it mildly. But what does that mean to the individual investors who may be following it? We humans experience time on a minute-by-minute basis. We’re not computers who can sweep across an 18½-year history without blinking an eye.
The answer is in Figure 3.
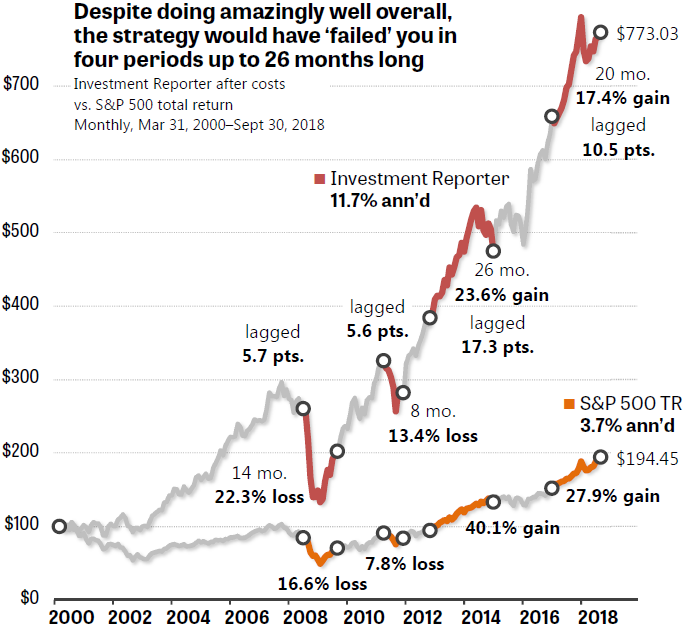
Figure 3. If you’d started following the Investment Reporter at the end of July 2008 — after it had a long hot streak — you would have experienced your portfolio lagging the S&P 500 in 72 months (six years) of the subsequent 10 years and 2 months. Source: HulbertRatings.com.
The Investment Reporter illustrates how difficult it is for individual investors to stick with an investing strategy that outperforms in the long run. A winning strategy such as that is almost certain to underperform the market for years at a time, disappointing you greatly.
Figure 3 shows that followers of the newsletter’s advice would have lagged the S&P 500’s total return:
- 5.7 points in 2008–2009 (14 months)
- 5.6 points in 2011–2012 (8 months)
- 17.3 points in 2013–2015 (26 months)
- 10.5 points in 2017–2018 (20 months)
The newsletter is lagging the S&P 500 even more during the current period, assuming the graph was extended with the latest numbers from Jan. 31, 2017, through Jan. 31, 2019. Talk about discouraging!
Any of those periods of underperforming the market — month after month and year after year — would make many investors decide “the formula isn’t working.” Actually, it’s working fine. It’s just that every superior investing strategy will have periods as long as several years when the formula simply lags whatever benchmark you may choose. Many people will throw in the towel when subjected to this much variability, which — ironically — is the way truly superior systems keep functioning without becoming overused.
Working around the human impatience factor
In this column, I’m not going to make a specific recommendation of any of the Honor Roll investment newsletters that HulbertRatings.com tracks. These advisory services all have the following problems for long-term investors:
- The newsletters advocate buying individual stocks. This leaves out tens of millions of 401(k)-type account holders, whose plans do not permit the purchase of marketable securities, only funds.
- The newsletters largely do not take advantage of the newer, cheaper-to-buy-and-sell ETFs. Nor do they generally incorporate index-fund asset classes that provide safe harbors from equities during market crashes, such as REITs, commodities, and precious metals.
- There’s no way to know when a newsletter will subject you to excruciating periods of market underperformance lasting one year, two years, or longer.
- The newsletter recommendations can crash worse than the S&P 500, whose collapses are already intolerable. From Oct. 31, 2007, through Feb. 28, 2009, the Investment Reporter’s portfolio vaporized more than 55% of its followers’ money. That’s heart-attack territory. The S&P 500, by contrast, lost “only” 52.6%, including dividends. Neither level of risk is acceptable to long-term savers. (The 16-month crash is not the largest underperformance in percentage points, which is why only a 22.3% loss, not 55%, is shown between the first two circular markers in Figure 3.)
For 21st-century investors, keeping losses below 20% to 25% — even in the worst 50% market crashes — is essential. This degree of risk reduction turns out to be easy to achieve with today’s knowledge, as described in my Muscular Portfolios summary. Furthermore, a user of a Muscular Portfolio has total confidence that his or her account will underperform the S&P 500 in every bull market. No need to guess! Nothing to fret about! The portfolio makes it all back, losing far less than the index in the bear market that is certain to follow a bull. The result is market-beating returns over complete bear-bull market cycles, which will always be with us.
In the remainder of this column, we’ll see other examples of how we can harness tracking error to work for us rather than letting it panic us into jumping from one disappointment to another.
• Parts 3, 4, and 5 appear on Feb. 12, 14, and 26, 2019.
With great knowledge comes great responsibility.
—Brian Livingston
Send story ideas to MaxGaines “at” BrianLivingston.com
