Jack Bogle, the founder of the Vanguard Group, has urged investors for over two decades to hold a simple 50/50 portfolio: half US stocks and half US bonds. • The book Muscular Portfolios calls this ‘the Baby Bear Portfolio.’ On first glance, it strikes many traders as too simple to work. But over the past 46 years, it’s delivered almost the same total return as the S&P 500 with much smaller losses.

Bogle addresses the Council of Institutional Investors in 2005. Photo by Ken Cedeno/Bloomberg/Getty Images.
• Parts 1 and 2 of this column appeared on Jan. 1, and 3, 2019. •
As we saw earlier, the Mama Bear Portfolio holds the three ETFs each month with the strongest momentum out of a menu of nine. The portfolio is outperforming the S&P 500 in the current bear-bull market cycle as well as overall during the past 46 years. Since Oct. 31, 2007, in the current cycle, the asset-rotation system returned 7.67% annualized. The S&P 500 total return (including dividends) was only 6.58%.
Both returns are respectable, but the Mama Bear’s was better. In simulations from 1973 through 2015, with results from real-money accounts in 2016 through 2018, the strategy has never lost more than 18%, measured between the ends of any two months. This degree of safety made a huge difference during market crashes, when the S&P 500 lost 30%, 40%, 50%, or more. The Mama Bear almost never beats the S&P 500 during a bull market. But the strategy’s small losses during bear markets — which occur every eight years, on average — help it outperform the benchmark in complete market cycles.
What if we use an even simpler strategy? Jack Bogle, founder of the Vanguard Group, has been advocating since at least 1996 that individual investors should hold only two index funds.
These two funds would represent all US stocks and all US bonds. The investor would own an equal weight of each asset class, keeping the portfolio divided 50/50 at all times. Near the end of a calendar year, rebalancing back to exactly 50/50 is called for if one asset is more than 5% above or below its ideal weight. (You can also keep the portfolio rebalanced by depositing or withdrawing money each month, using whichever fund is most off its target. Figure 1, below, ignores such deposits and withdrawals.)
Bogle originally proposed his plan in a paper titled “My Alma Mater’s Money.” He presented it in 1996 to an audience of college endowment fund managers. Fifteen years later, Bogle crowed to the same conference that his 50/50 plan had outperformed the average of the smarty-pants university professionals, after adjusting for risk.
Without the risk adjustment, the two-asset portfolio returned 7.1% annualized in raw performance. On average, the endowment managers had returned 7.3% — only slightly more gain for all their trading. Best of all, Bogle’s 50/50 portfolio flatly outperformed the professionals who managed less than half a billion dollars. Their average return was only 7.0%.
In both papers, Bogle recommended two Vanguard mutual funds that hold all US stocks (VTSMX) and all US bonds (VBMFX). There can hardly be any debate about the real-money return of these two funds. Both VTSMX and VBMFX have existed — with well-documented track records — since 1992. Anyone can go back, see how much those funds gained over time, and calculate the return of a 50/50 portfolio.
News flash: Vanguard closed VTSMX and VBMFX, which are called Investor Shares, to new investors in late 2018. The funds still exist, but Vanguard directs new investors to VTSAX and VBTLX, the company’s Admiral Shares. The latter two funds now require minimum investments of $3,000 — down from their previous $10,000 minimums.
The book Muscular Portfolios “clones” Bogle’s 50/50 strategy and calls it the Baby Bear Portfolio. Instead of mutual funds, the clone uses the exchange-traded funds VTI and BND to get the benefits of ETFs. Vanguard manages its mutual funds and ETFs in identical ways, so the gains and losses of the two vehicles are essentially the same. However, ETFs have great advantages:
- You can buy and sell ETF shares at any time during market hours. Mutual funds only transact at 4 p.m. Eastern Time. You then have to wait until the next day to learn how much you paid or received for your stake.
- Mutual funds declare “phantom gains” (distributions) near the end of each year. In a taxable account, US citizens are required to pay capital-gains tax on these amounts, even though the investors never sold any shares of the funds. ETFs almost never declare phantom gains.
- Many mutual funds have minimum required investment amounts, and/or they charge expenses called 12b-1 fees, front-end loads, or redemption charges. ETFs have no minimums and charge none of these expenses, all of which cut into your performance.
The Baby Bear is not a Muscular Portfolio. The two-asset plan lacks true diversification and doesn’t take advantage of momentum. Instead, the book describes the 50/50 strategy as a good “starter portfolio” for novices who have less than $10,000 to invest. Holding only two ETFs and making very infrequent trades keeps a new investor’s expenses well below 1% a year. Even the Mad Money show’s Jim Cramer, a huge guru of stock trading, recommends that people with less than $10,000 to invest should hold index funds rather than individual stocks.
The Holy Grail is available with only two funds
OK, so the 50/50 portfolio is simple, but how does it perform? Figure 1 shows that the Baby Bear Portfolio rewards long-term investors with a virtually identical return as the S&P 500 (including dividends). But the 50/50 strategy subjects account holders to losses that are much less than the index’s losses during crashes.
Pundits often joke that the Holy Grail of Investing would be a portfolio with market-like returns but only bond-like volatility, as though such a thing could never exist. The Baby Bear is proof — easily verified with market data — that the Holy Grail is simple for anyone to achieve. Over the entire 46-year history in Figure 1, the Baby Bear returned 9.5% annualized. The S&P 500 returned only slightly more: 9.9%. Any portfolio that achieves an annualized return within 1 percentage point of the index is delivering a market-like return.
Even better, the Baby Bear Portfolio floated right through crashes like the S&P 500’s 51% loss in 2007–2009. The 50/50 strategy lost only 29% — less than six-tenths of the benchmark’s heart-stopping collapse.
From December 2008 through June 2009, one Vanguard government bond fund — EDV — lost 40% of its value when interest rates rose. The Baby Bear’s 29% loss in 2007–2009 is well below the worst bond-like volatility investors experience.
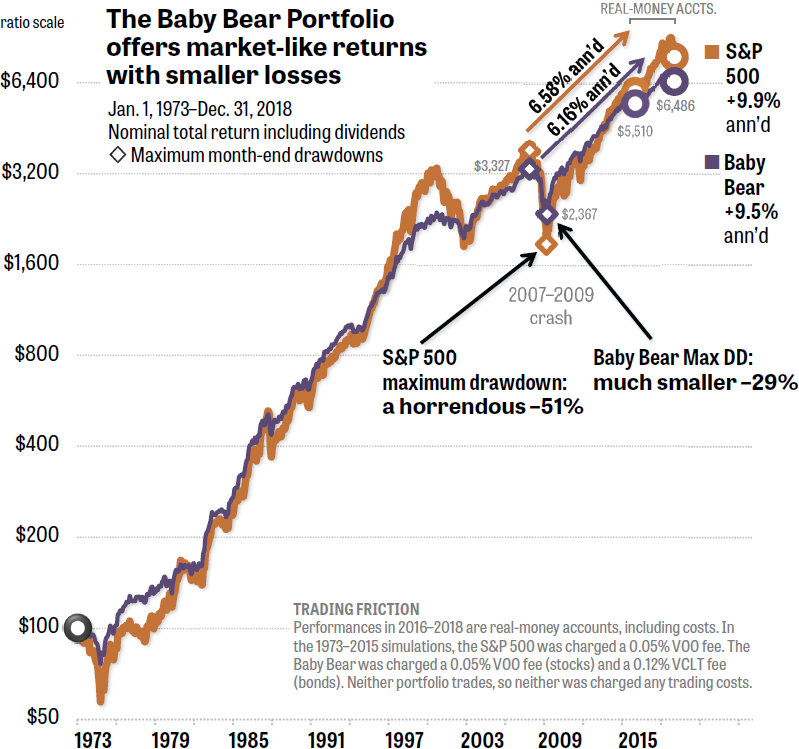
Figure 1. A 50/50 portfolio of stocks and bonds produces returns that are within a fraction of 1 percentage point of those generated by the crash-prone S&P 500, even when dividends are included. Source: Quant simulator.
In Figure 1, the years 1973 through 2015 are simulated by Mebane Faber’s Quant program. The numbers from 2016 through 2018 are from a real-money account that I established at FolioInvesting.com to provide an unquestioned record of performance.
The shortest period that should ever be used to evaluate portfolios is one bear market and one bull market — and preferably more than one. Readers have asked me about the performances of the portfolios since the ending of the graphs in the book at Dec. 31. 2015. The performance of the real-money account is indicated between the purple and orange circles in Figure 1.
From Oct. 31, 2007, through Dec. 31, 2018 — the current bear-bull market cycle — the S&P 500 including dividends returned 6.58% annualized. The simple Baby Bear Portfolio returned 6.16%. The 50/50 strategy returned less than the all-stock index, but not ridiculously less.
The two-asset portfolio, consisting as it does of 50% bonds, isn’t expected to outrun US equities during a roaring bull market. Even so, the Baby Bear remarkably catches up with the benchmark at the end of every bear market. In fact, starting from Jan. 1, 1973, an investor who held two real-money accounts — one for the Baby Bear and one for the S&P 500 — would have found that the Baby Bear account held more dollars in 61% of the months. Market-like returns, indeed!
Figure 1 shows the dollar amounts of the hypothetical Baby Bear account at various points: the beginning of the bear market in 2007, the beginning of the bull market in 2009, the end of the Quant simulation, and the end of 2018. The Baby Bear turned $3,327 into $6,486 to generate its annualized return of 6.16%. The S&P 500 total return turned $3,840 into $7,819 for 6.58% annualized.
It’s important to note that the return of the two-asset portfolio is not the average of the stock gains and the bond gains. From 1973 through 2015, the S&P 500 total return was 10.0% annualized. An index of US bonds returned 8.9% (as shown in Chapter 9 of the book). The average would be 9.45%. But the 50/50 portfolio returned 9.8% — almost as much as the S&P 500 itself.
The explanation is that, as statisticians say, “recovery times increase geometrically.” If a portfolio loses 50%, it must gain 100% to get back to even. But if a diversified portfolio loses only 25%, it needs to gain just 33.3% to be whole again. The expert strategies in the book take advantage of this mathematical quirk by keeping their losses low during bear markets. As we’ve seen, this kind of risk reduction is not hard to achieve.
Because the lines of the two strategies in Figure 1 closely criss-cross each other, the graph omits dollar amounts for the S&P 500 for the sake of readability. Also, the drawdowns experienced in the first three crashes — 1973–1974, 1987, and 2000–2002 — are not shown. These details are easier to see on the graph for the Mama Bear Portfolio in Part 2 of this column.
What if you have more than $10,000 to invest? In that case, a genuine Muscular Portfolio like the Mama Bear would be a better bet for you than the two-asset strategy.
In the fourth and final part of this column, we’ll see the real-money performance of the Papa Bear Portfolio, with its complete set of 13 asset classes.
• Part 4 appears on Jan. 10, 2019.
With great knowledge comes great responsibility.
—Brian Livingston
Send story ideas to MaxGaines “at” BrianLivingston.com
